
Page 240 - Characterization and Properties of Petroleum Fractions - M.R. Riazi
P. 240
QC: IML/FFX
P1: IML/FFX
AT029-Manual
August 16, 2007
AT029-05
220 CHARACTERIZATION AND PROPERTIES OF PETROLEUM FRACTIONS
(0)
(1)
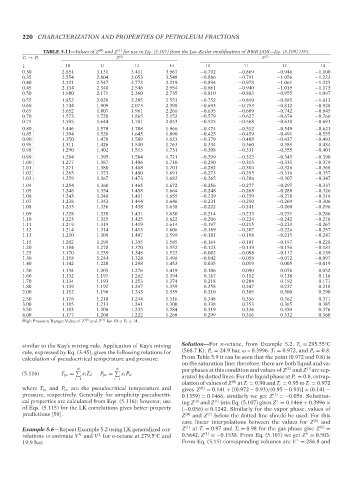
TABLE 5.11—Values of Z
for use in Eq. (5.107) from the Lee–Kesler modification of BWR EOS—Eq. (5.109) [59].
and Z
(0)
Z
T r → P r P2: IML/FFX AT029-Manual-v7.cls T1: IML 17:42 Z (1)
↓ 10 11 12 14 10 11 12 14
0.30 2.851 3.131 3.411 3.967 −0.792 −0.869 −0.946 −1.100
0.35 2.554 2.804 3.053 3.548 −0.886 −0.791 −1.056 −1.223
0.40 2.321 2.547 2.772 3.219 −0.894 −0.978 −1.061 −1.225
0.45 2.134 2.340 2.546 2.954 −0.861 −0.940 −1.019 −1.173
0.50 1.980 2.171 2.360 2.735 −0.810 −0.883 −0.955 −1.097
0.55 1.852 2.029 2.205 2.553 −0.752 −0.819 −0.885 −1.013
0.60 1.744 1.909 2.073 2.398 −0.693 −0.753 −0.812 −0.928
0.65 1.652 1.807 1.961 2.266 −0.635 −0.689 −0.742 −0.845
0.70 1.573 1.720 1.865 2.152 −0.579 −0.627 −0.674 −0.766
0.75 1.505 1.644 1.781 2.053 −0.525 −0.568 −0.610 −0.691
1.446 1.578 1.708 1.966 −0.474 −0.512 −0.549 −0.621
0.85 1.394 1.520 1.645 1.890 −0.425 −0.459 −0.491 −0.555
0.90 1.350 1.470 1.589 1.823 −0.379 −0.408 −0.437 −0.493
0.95 1.311 1.426 1.540 1.763 −0.334 −0.360 −0.385 −0.434
0.98 1.290 1.402 1.513 1.731 −0.308 −0.331 −0.355 −0.401
0.99 1.284 1.395 1.504 1.721 −0.299 −0.322 −0.345 −0.390
1.00 1.277 1.387 1.496 1.710 −0.290 −0.313 −0.335 −0.379
1.01 1.271 1.380 1.488 1.701 −0.282 −0.304 −0.326 −0.368
1.02 1.265 1.373 1.480 1.691 −0.273 −0.295 −0.316 −0.357
1.03 1.259 1.367 1.473 1.682 −0.265 −0.286 −0.307 −0.347
0.80 --`,```,`,``````,`,````,```,,-`-`,,`,,`,`,,`---
1.04 1.254 1.360 1.465 1.672 −0.256 −0.277 −0.297 −0.337
1.05 1.248 1.354 1.458 1.664 −0.248 −0.268 −0.288 −0.326
1.06 1.243 1.348 1.451 1.655 −0.239 −0.259 −0.278 −0.316
1.07 1.238 1.342 1.444 1.646 −0.231 −0.250 −0.269 −0.306
1.08 1.233 1.336 1.438 1.638 −0.222 −0.241 −0.260 −0.296
1.09 1.228 1.330 1.431 1.630 −0.214 −0.233 −0.251 −0.286
1.10 1.223 1.325 1.425 1.622 −0.206 −0.224 −0.242 −0.276
1.11 1.219 1.319 1.419 1.614 −0.197 −0.215 −0.233 −0.267
1.12 1.214 1.314 1.413 1.606 −0.189 −0.207 −0.224 −0.257
1.13 1.210 1.309 1.407 1.599 −0.181 −0.198 −0.215 −0.247
1.15 1.202 1.299 1.395 1.585 −0.164 −0.181 −0.197 −0.228
1.20 1.184 1.278 1.370 1.552 −0.123 −0.139 −0.154 −0.183
1.25 1.170 1.259 1.348 1.522 −0.082 −0.098 −0.112 −0.139
1.30 1.158 1.244 1.328 1.496 −0.042 −0.058 −0.072 −0.097
1.40 1.142 1.220 1.298 1.453 0.035 0.019 0.005 −0.019
1.50 1.134 1.205 1.276 1.419 0.106 0.090 0.076 0.052
1.60 1.132 1.197 1.262 1.394 0.167 0.152 0.138 0.116
1.70 1.134 1.193 1.253 1.374 0.218 0.204 0.192 0.171
1.80 1.139 1.192 1.247 1.359 0.258 0.247 0.237 0.218
2.00 1.152 1.196 1.243 1.339 0.310 0.305 0.300 0.290
2.50 1.176 1.210 1.244 1.316 0.348 0.356 0.362 0.371
3.00 1.185 1.213 1.241 1.300 0.338 0.353 0.365 0.385
3.50 1.183 1.208 1.233 1.284 0.319 0.336 0.350 0.376
4.00 1.177 1.200 1.222 1.268 0.299 0.316 0.332 0.360
High Pressure Range: Value of Z (0) and Z (1) for 10 ≤ P r ≤ 14.
◦
similar to the Kay’s mixing rule. Application of Kay’s mixing Solution—For n-octane, from Example 5.2, T c = 295.55 C
rule, expressed by Eq. (3.45), gives the following relations for (568.7 K), P c = 24.9 bar, ω = 0.3996. T r = 0.972, and P r = 0.8.
calculation of pseudocritical temperature and pressure: From Table 5.9 it can be seen that the point (0.972 and 0.8) is
on the saturation line; therefore, there are both liquid and va-
(1)
por phases at this condition and values of Z (0) and Z are sep-
(5.116) T pc = x i T ci P pc = x i P ci
N !
N !
i=1 i=1 arated by dotted lines. For the liquid phase at P r = 0.8, extrap-
olation of values of Z (0) at T r = 0.90 and T r = 0.95 to T r = 0.972
where T pc and P pc are the pseudocritical temperature and gives Z (0) = 0.141 + [(0.972 − 0.93)/(0.95 − 0.93)] × (0.141 −
pressure, respectively. Generally for simplicity pseudocriti- 0.1359) = 0.1466, similarly we get Z (1) =−0.056. Substitut-
cal properties are calculated from Eqs. (5.116); however, use ing Z (0) and Z (1) into Eq. (5.107) gives Z = 0.1466 + 0.3996 ×
L
of Eqs. (5.115) for the LK correlations gives better property (−0.056) = 0.1242. Similarly for the vapor phase, values of
predictions [59]. Z (0) and Z (1) below the dotted line should be used. For this
case linear interpolations between the values for Z (0) and
Example 5.6—Repeat Example 5.2 using LK generalized cor- Z (1) at T r = 0.97 and T r = 0.98 for the gas phase give Z (0) =
V
L
V
relations to estimate V and V for n-octane at 279.5 C and 0.5642, Z (1) =−0.1538. From Eq. (5.107) we get Z = 0.503.
◦
L
19.9 bar. From Eq. (5.15) corresponding volumes are V = 286.8 and
Copyright ASTM International
Provided by IHS Markit under license with ASTM Licensee=International Dealers Demo/2222333001, User=Anggiansah, Erick
No reproduction or networking permitted without license from IHS Not for Resale, 08/26/2021 21:56:35 MDT