
Page 378 - Mechanical Behavior of Materials
P. 378
Section 8.6 Fracture Toughness Values and Trends 379
o
Temperature, F
-300 -200 -100 0
100
-5
•
100 Slow, ε 10 1/s -3 1/s σ = 345 MPa 80
ASTM A572 steel
K , Fracture Toughness, MPa m 60 60 K Ic
Intermediate, 10
o
Dynamic, 10 1/s
80
ksi in
40
40
20
Ic
0 20
0
-200 -150 -100 -50 0
o
Temperature, C
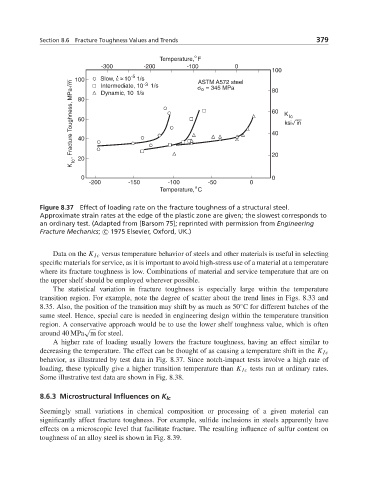
Figure 8.37 Effect of loading rate on the fracture toughness of a structural steel.
Approximate strain rates at the edge of the plastic zone are given; the slowest corresponds to
an ordinary test. (Adapted from [Barsom 75]; reprinted with permission from Engineering
Fracture Mechanics; c 1975 Elsevier, Oxford, UK.)
Data on the K Ic versus temperature behavior of steels and other materials is useful in selecting
specific materials for service, as it is important to avoid high-stress use of a material at a temperature
where its fracture toughness is low. Combinations of material and service temperature that are on
the upper shelf should be employed wherever possible.
The statistical variation in fracture toughness is especially large within the temperature
transition region. For example, note the degree of scatter about the trend lines in Figs. 8.33 and
8.35. Also, the position of the transition may shift by as much as 50 C for different batches of the
◦
same steel. Hence, special care is needed in engineering design within the temperature transition
region. A conservative approach would be to use the lower shelf toughness value, which is often
√
around 40 MPa m for steel.
A higher rate of loading usually lowers the fracture toughness, having an effect similar to
decreasing the temperature. The effect can be thought of as causing a temperature shift in the K Ic
behavior, as illustrated by test data in Fig. 8.37. Since notch-impact tests involve a high rate of
loading, these typically give a higher transition temperature than K Ic tests run at ordinary rates.
Some illustrative test data are shown in Fig. 8.38.
8.6.3 Microstructural Influences on K Ic
Seemingly small variations in chemical composition or processing of a given material can
significantly affect fracture toughness. For example, sulfide inclusions in steels apparently have
effects on a microscopic level that facilitate fracture. The resulting influence of sulfur content on
toughness of an alloy steel is shown in Fig. 8.39.