
Page 413 - Mechanical Behavior of Materials
P. 413
414 Chapter 8 Fracture of Cracked Members
(a) Calculate K Q corresponding to P Q .
(b) At the K Q point, determine whether or not plane strain applies and whether or not
LEFM is applicable.
(c) What is the significance of the K Q calculated?
8.49 A fracture toughness test was conducted on AISI 4340 steel having a yield strength
of 1380 MPa. The standard compact specimen used had dimensions, as defined in
Fig. 8.16, of b = 50.8 mm, t = 12.95 mm, and a sharp precrack to a = 25.4 mm. Failure
occurred suddenly at P Q = P max = 15.03 kN, with the P-v curve resembling Type III of
Fig. 8.28.
(a) Calculate K Q at fracture.
(b) Does this value qualify as a valid (plane strain) K Ic value?
(c) Estimate the plastic zone size at fracture.
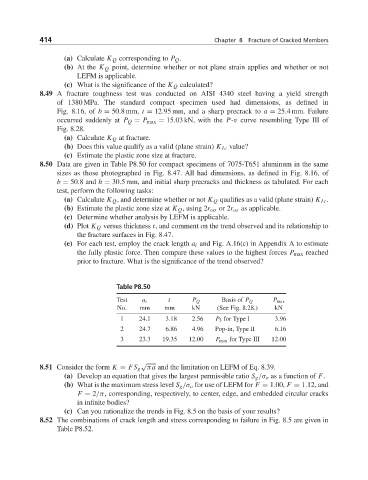
8.50 Data are given in Table P8.50 for compact specimens of 7075-T651 aluminum in the same
sizes as those photographed in Fig. 8.47. All had dimensions, as defined in Fig. 8.16, of
b = 50.8 and h = 30.5 mm, and initial sharp precracks and thickness as tabulated. For each
test, perform the following tasks:
(a) Calculate K Q , and determine whether or not K Q qualifies as a valid (plane strain) K Ic .
(b) Estimate the plastic zone size at K Q ,using 2r oσ or 2r oε as applicable.
(c) Determine whether analysis by LEFM is applicable.
(d) Plot K Q versus thickness t, and comment on the trend observed and its relationship to
the fracture surfaces in Fig. 8.47.
(e) For each test, employ the crack length a i and Fig. A.16(c) in Appendix A to estimate
the fully plastic force. Then compare these values to the highest forces P max reached
prior to fracture. What is the significance of the trend observed?
Table P8.50
Test a i t P Q Basis of P Q P max
No. mm mm kN (See Fig. 8.28.) kN
1 24.1 3.18 2.56 P 5 for Type I 3.96
2 24.7 6.86 4.96 Pop-in, Type II 6.16
3 23.3 19.35 12.00 P max for Type III 12.00
√
8.51 Consider the form K = FS g πa and the limitation on LEFM of Eq. 8.39.
(a) Develop an equation that gives the largest permissible ratio S g /σ o as a function of F.
(b) What is the maximum stress level S g /σ o for use of LEFM for F = 1.00, F = 1.12, and
F = 2/π, corresponding, respectively, to center, edge, and embedded circular cracks
in infinite bodies?
(c) Can you rationalize the trends in Fig. 8.5 on the basis of your results?
8.52 The combinations of crack length and stress corresponding to failure in Fig. 8.5 are given in
Table P8.52.