Page 414 - Mechanical Behavior of Materials
P. 414

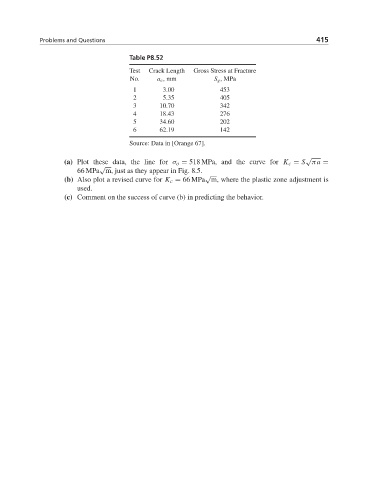
Problems and Questions                                                     415

                                    Table P8.52

                                    Test  Crack Length  Gross Stress at Fracture
                                     No.    a c ,mm         S g ,MPa
                                     1        3.00           453
                                     2        5.35           405
                                     3       10.70           342
                                     4       18.43           276
                                     5       34.60           202
                                     6       62.19           142
                                    Source: Data in [Orange 67].

                                                                                     √
                   (a) Plot these data, the line for σ o = 518 MPa, and the curve for K c = S πa =
                            √
                      66 MPa m, just as they appear in Fig. 8.5.
                                                         √
                   (b) Also plot a revised curve for K c = 66 MPa m, where the plastic zone adjustment is
                      used.
                   (c) Comment on the success of curve (b) in predicting the behavior.
   409   410   411   412   413   414   415   416   417   418   419