
Page 443 - Mechanical Behavior of Materials
P. 443
Section 9.6 Trends in S-N Curves 443
σ , ksi
u
20
0 Wrought Al alloys 40 60 80 30
σ erb , Fatigue Limit, MPa 100 m = 0.4 σ erb = 130 MPa 20 σ erb , ksi
200
200
10
0 100 200 e 300 400 500 600 0
σ , Ultimate Tensile Strength, MPa
u
8
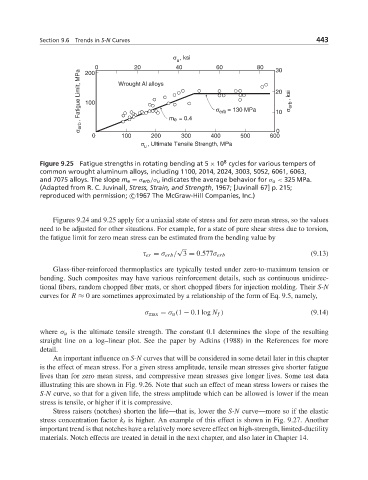
Figure 9.25 Fatigue strengths in rotating bending at 5 × 10 cycles for various tempers of
common wrought aluminum alloys, including 1100, 2014, 2024, 3003, 5052, 6061, 6063,
and 7075 alloys. The slope m e = σ erb /σ u indicates the average behavior for σ u < 325 MPa.
(Adapted from R. C. Juvinall, Stress, Strain, and Strength, 1967; [Juvinall 67] p. 215;
reproduced with permission; c 1967 The McGraw-Hill Companies, Inc.)
Figures 9.24 and 9.25 apply for a uniaxial state of stress and for zero mean stress, so the values
need to be adjusted for other situations. For example, for a state of pure shear stress due to torsion,
the fatigue limit for zero mean stress can be estimated from the bending value by
√
(9.13)
τ er = σ erb / 3 = 0.577σ erb
Glass-fiber-reinforced thermoplastics are typically tested under zero-to-maximum tension or
bending. Such composites may have various reinforcement details, such as continuous unidirec-
tional fibers, random chopped fiber mats, or short chopped fibers for injection molding. Their S-N
curves for R ≈ 0 are sometimes approximated by a relationship of the form of Eq. 9.5, namely,
σ max = σ u (1 − 0.1log N f ) (9.14)
where σ u is the ultimate tensile strength. The constant 0.1 determines the slope of the resulting
straight line on a log–linear plot. See the paper by Adkins (1988) in the References for more
detail.
An important influence on S-N curves that will be considered in some detail later in this chapter
is the effect of mean stress. For a given stress amplitude, tensile mean stresses give shorter fatigue
lives than for zero mean stress, and compressive mean stresses give longer lives. Some test data
illustrating this are shown in Fig. 9.26. Note that such an effect of mean stress lowers or raises the
S-N curve, so that for a given life, the stress amplitude which can be allowed is lower if the mean
stress is tensile, or higher if it is compressive.
Stress raisers (notches) shorten the life—that is, lower the S-N curve—more so if the elastic
stress concentration factor k t is higher. An example of this effect is shown in Fig. 9.27. Another
important trend is that notches have a relatively more severe effect on high-strength, limited-ductility
materials. Notch effects are treated in detail in the next chapter, and also later in Chapter 14.