
Page 438 - Mechanical Behavior of Materials
P. 438
438 Chapter 9 Fatigue of Materials: Introduction and Stress-Based Approach
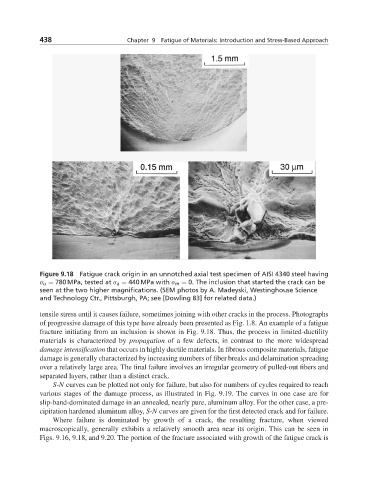
Figure 9.18 Fatigue crack origin in an unnotched axial test specimen of AISI 4340 steel having
σ u = 780 MPa, tested at σ a = 440 MPa with σ m = 0. The inclusion that started the crack can be
seen at the two higher magnifications. (SEM photos by A. Madeyski, Westinghouse Science
and Technology Ctr., Pittsburgh, PA; see [Dowling 83] for related data.)
tensile stress until it causes failure, sometimes joining with other cracks in the process. Photographs
of progressive damage of this type have already been presented as Fig. 1.8. An example of a fatigue
fracture initiating from an inclusion is shown in Fig. 9.18. Thus, the process in limited-ductility
materials is characterized by propagation of a few defects, in contrast to the more widespread
damage intensification that occurs in highly ductile materials. In fibrous composite materials, fatigue
damage is generally characterized by increasing numbers of fiber breaks and delamination spreading
over a relatively large area. The final failure involves an irregular geometry of pulled-out fibers and
separated layers, rather than a distinct crack.
S-N curves can be plotted not only for failure, but also for numbers of cycles required to reach
various stages of the damage process, as illustrated in Fig. 9.19. The curves in one case are for
slip-band-dominated damage in an annealed, nearly pure, aluminum alloy. For the other case, a pre-
cipitation hardened aluminum alloy, S-N curves are given for the first detected crack and for failure.
Where failure is dominated by growth of a crack, the resulting fracture, when viewed
macroscopically, generally exhibits a relatively smooth area near its origin. This can be seen in
Figs. 9.16, 9.18, and 9.20. The portion of the fracture associated with growth of the fatigue crack is