
Page 124 - Introduction to Statistical Pattern Recognition
P. 124
106 Introduction to Statistical Pattern Recognition
1.
[?Iv
]+i In+ I [2]"+ (3.165)
(al/adV +(a2/aI)v
2
L -I
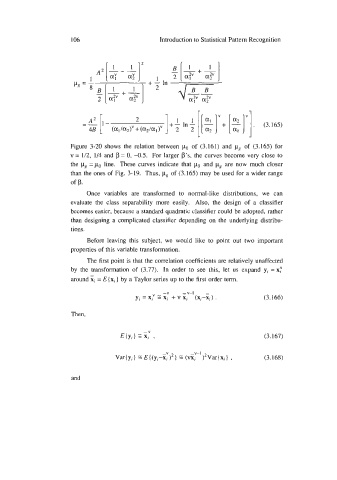
Figure 3-20 shows the relation between of (3.161) and pg of (3.165) for
v = 112, 1/4 and p = 0, -0.5. For larger p's, the curves become very close to
the pg =po line. These curves indicate that po and pg are now much closer
than the ones of Fig. 3-19. Thus, pg of (3.165) may be used for a wider range
of p.
Once variables are transformed to normal-like distributions, we can
evaluate the class separability more easily. Also, the design of a classifier
becomes easier, because a standard quadratic classifier could be adopted, rather
than designing a complicated classifier depending on the underlying distribu-
tions.
Before leaving this subject, we would like to point out two important
properties of this variable transformation.
The first point is that the correlation coefficients are relatively unaffected
by the transformation of (3.77). In order to see this, let us expand yi = xr
around xi = E { xi 1 by a Taylor series up to the first order term.
-v -v-l -
y; = xy 2 x; + v x; (xi-Xi) . (3.166)
Then,
(3.167)
(3.168)
and