
Page 127 - Introduction to Statistical Pattern Recognition
P. 127
3 Hypothesis Testing 109
(3.174)
,% (P+l+i)*
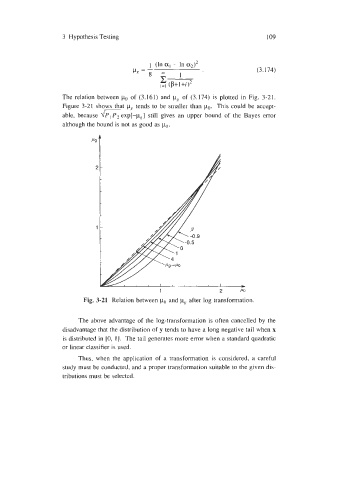
The relation between po of (3.161) and pCq of (3.174) is plotted in Fig. 3-21.
Figure 3-21 shows that pR tends to be smaller than po. This could be accept-
able, because Gexp[-y] still gives an upper bound of the Bayes error
although the bound is not as good as po.
2
1
1 2 /lo
Fig. 3-21 Relation between po and pLS after log transformation.
The above advantage of the log-transformation is often cancelled by the
disadvantage that the distribution of y tends to have a long negative tail when x
is distributed in [0, I]. The tail generates more error when a standard quadratic
or linear classifier is used.
Thus, when the application of a transformation is considered, a careful
study must be conducted, and a proper transformation suitable to the given dis-
tributions must be selected.