Page 297 - Introduction to Statistical Pattern Recognition
P. 297

6  Nonparametric Density Estimation                          279
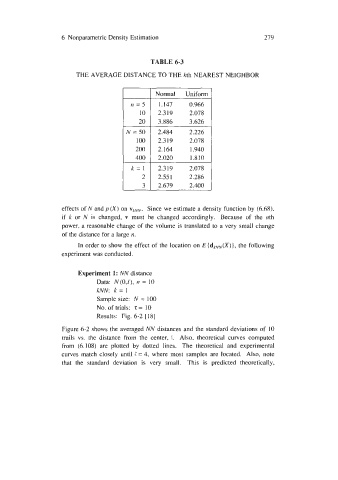


                                               TABLE 6-3

                        THE AVERAGE DISTANCE TO THE kth NEAREST NEIGHBOR

                                                Normal   Uniform
                                         n=5     1.147     0.966
                                           10    2.319     2.078
                                           20    3.886     3.626
                                       ~
                                       N = 50    2.484     2.226
                                          100    2.319     2.078
                                          200    2.164     1.940
                                          400    2.020     1.810
                                         k=l     2.319     2.078
                                            2    2.55 1    2.286
                                            3    2.679     2.400


                    effects of N  and p (X) on  v~NN. Since we estimate a density function by  (6.68),
                    if  k  or  N  is  changed,  v  must  be  changed  accordingly.  Because  of  the  nth
                    power, a reasonable change of  the volume is translated to a very small change
                    of the distance for a large n.
                         In order to show the effect of  the location on E(dkNN(X)}, the following
                    experiment was conducted.

                         Experiment 1: NN distance
                              Data:  N(O,I), n = 10
                              kNN:  k  = 1
                               Sample size:  N  = 100
                              No. of trials:  2 = 10
                               Results:  Fig. 6-2 [ 181

                    Figure 6-2 shows the averaged NN distances and the standard deviations of  10
                    trails  vs.  the  distance  from  the  center, !.  Also,  theoretical  curves  computed
                    from  (6.108) are  plotted  by  dotted  lines.  The  theoretical  and  experimental
                    curves match  closely  until L  = 4, where  most  samples are located.  Also, note
                    that  the  standard  deviation  is  very  small.  This  is  predicted  theoretically,
   292   293   294   295   296   297   298   299   300   301   302