
Page 345 - Introduction to Statistical Pattern Recognition
P. 345
7 Nonparametric Classification and Error Estimation 327
reached, and then increases as the bias terms of the density estimates become
more significant. This behavior is observed in Fig. 7-7 and is accurately
predicted in the expression for E(AE]. It should be noted that although expli-
cit evaluation of al through a3 is not possible in general, it is reasonable to
expect that these constants are positive. It is certainly true that E ( AE} must be
positive for any value of r, since the Bayes decision rule is optimal in terms of
error performance.
Effect of Other Parameters in the Parzen Approach
With the bias expression of the estimated error, (7.52), we can now dis-
cuss the effect of important parameters such as N, t, and the shape of the kernel
function.
Effect of sample size: The role of the sample size, N, in (7.52) is seen
as a means of reducing the term corresponding to the variance of the density
estimates. Hence the primary effect of the sample size is seen at the smaller
values of I; where the u3 term of (7.52) dominates. As I’ grows, and the al
and a2 terms become dominant, changing the sample size has a decreasing
effect on the resulting error rate. These observations were verified experimen-
tally.
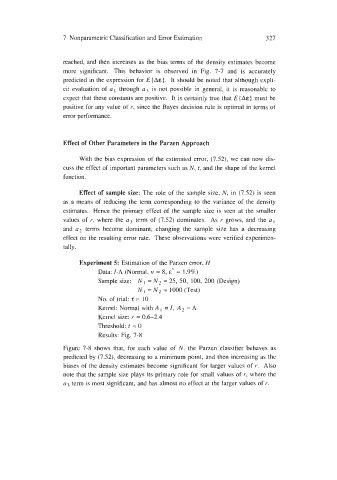
Experiment 5: Estimation of the Parzen error, H
Data: I-A (Normal, n = 8, E* = 1.9%)
Sample size: N I = N2 = 25, 50, 100, 200 (Design)
N, = N2 = 1000 (Test)
No. of trial: T = 10
Kernel: Normal with A I = I, A2 = A
Kernel size: I- = 0.6-2.4
Threshold: f = 0
Results: Fig. 7-8
Figure 7-8 shows that, for each value of N, the Parzen classifier behaves as
predicted by (7.52), decreasing to a minimum point, and then increasing as the
biases of the density estimates become significant for larger values of r. Also
note that the sample size plays its primary role for small values of 1’, where the
u3 term is most significant, and has almost no effect at the larger values of I’.