
Page 346 - Introduction to Statistical Pattern Recognition
P. 346
328 Introduction to Statistical Pattern Recognition
E(%)
7.0 .f
0 N=25 9p
0 N=50
A N=100 H
X N=200 0
5.0
0
1 .o 2.0
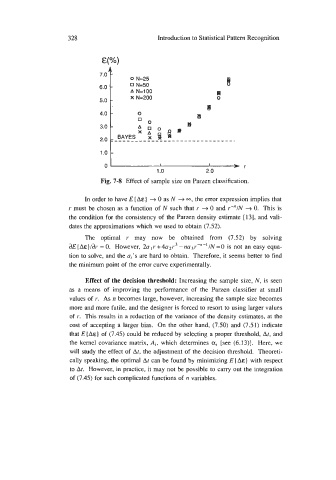
Fig. 7-8 Effect of sample size on Parzen classification.
In order to have E [A&} + 0 as N + 00, the error expression implies that
r must be chosen as a function of N such that I' + 0 and r-"/N + 0. This is
the condition for the consistency of the Parzen density estimate [ 131, and vali-
dates the approximations which we used to obtain (7.52).
The optimal r may now be obtained from (7.52) by solving
aE { A&)/& = 0. However, 2aI r +4a2r3 -na3r-"-'IN =O is not an easy equa-
tion to solve, and the ai's are hard to obtain. Therefore, it seems better to find
the minimum point of the error curve experimentally.
Effect of the decision threshold: Increasing the sample size, N, is seen
as a means of improving the performance of the Parzen classifier at small
values of r. As n becomes large, however, increasing the sample size becomes
more and more futile, and the designer is forced to resort to using larger values
of r. This results in a reduction of the variance of the density estimates, at the
cost of accepting a larger bias. On the other hand, (7.50) and (7.51) indicate
that E (A&] of (7.45) could be reduced by selecting a proper threshold, At, and
the kernel covariance matrix, A;, which determines a; [see (6.13)]. Here, we
will study the effect of At, the adjustment of the decision threshold. Theoreti-
cally speaking, the optimal At can be found by minimizing E (A&] with respect
to Ar. However, in practice, it may not be possible to carry out the integration
of (7.45) for such complicated functions of n variables.