
Page 363 - Introduction to Statistical Pattern Recognition
P. 363
7 Nonparametric Classification and Error Estimation 345
As mentioned earlier, it is reasonable to expect that all four of the con-
stants in (7.70) are positive, since the observed error must remain above &* for
any value of r. In order to ensure stability in the estimate of E*, it is advisable
to restrict the constants to positive values during the curve fit procedure.
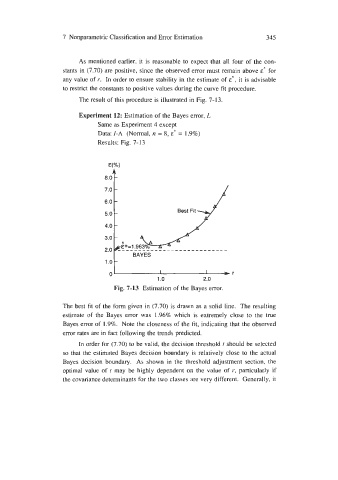
The result of this procedure is illustrated in Fig. 7-13.
Experiment 12: Estimation of the Bayes error, L
Same as Experiment 4 except
Data: I-A (Normal, n = 8, E* = 1.9%)
Results: Fig. 7-13
1.01
0’ I I )r
1 .o 2.0
Fig. 7-13 Estimation of the Bayes error.
The best fit of the form given in (7.70) is drawn as a solid line. The resulting
estimate of the Bayes error was 1.96% which is extremely close to the true
Bayes error of 1.9%. Note the closeness of the fit, indicating that the observed
error rates are in fact following the trends predicted.
In order for (7.70) to be valid, the decision threshold t should be selected
so that the estimated Bayes decision boundary is relatively close to the actual
Bayes decision boundary. As shown in the threshold adjustment section, the
optimal value of t may be highly dependent on the value of I-, particularly if
the covariance determinants for the two classes are very different. Generally, it