
Page 364 - Introduction to Statistical Pattern Recognition
P. 364
346 Introduction to Statistical Pattern Recognition
is advisable to evaluate the Parzen classifier for a variety of values of f, and
then apply the curve fit procedure for each value of t. This results in a negligi-
ble increase of the computational burden, since the bulk of the time is spent
calculating the density estimates, and only a very small percentage comparing
the estimates to the thresholds.
Experiment 13: Estimation of the Bayes error, L
Same as Experiment 12 except
Data: 1-1, 1-41, I-A (Normal, n = 8)
Threshold: t of (7.56), I' = 0.6-2.4 in steps of 0.2
Results: Table 7-4
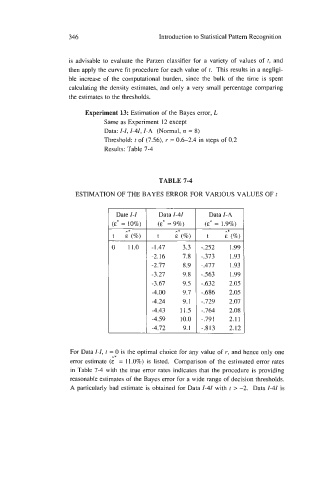
TABLE 7-4
ESTIMATION OF THE BAYES ERROR FOR VARIOUS VALUES OF r
Date I-I Data 1-41 Data I-A
(E* = 10%) (E* = 9%) (E* = 1.9%)
t E*(%) t E*(%) t r*
E (%)
0 11.0 - 1.47 3.3 -.252 1.99
-2.16 7.8 -.373 1.93
-2.77 8.9 -.477 1.93
-3.27 9.8 -.563 1.99
-3.67 9.5 -.632 2.05
-4.00 9.7 -.686 2.05
-4.24 9.1 -.729 2.07
-4.43 11.5 -.764 2.08
-4.59 10.0 -.791 2.1 1
-4.72 9.1 -.813 2.12
For Data 1-1, t = 0 is the optimal choice for any value of r, and hence only one
A*
error estimate (E = 11.0%) is listed. Comparison of the estimated error rates
in Table 7-4 with the true error rates indicates that the procedure is providing
reasonable estimates of the Bayes error for a wide range of decision thresholds.
A particularly bad estimate is obtained for Data 1-41 with t > -2. Data 1-41 is