
Page 277 - Petroleum Production Engineering, A Computer-Assisted Approach
P. 277
Guo, Boyun / Computer Assited Petroleum Production Engg 0750682701_chap18 Final Proof page 277 4.1.2007 10:04pm Compositor Name: SJoearun
PRODUCTION OPTIMIZATION 18/277
Table 18.2 Solution to Example Problem 18.3 Given by the Spreadsheet LoopedLines.xls
LoopedLines.xls
This spreadsheet computes capacities of series, parallel, and looped pipelines.
Input data
Original pipe ID: 4 in.
Total pipeline length: 10 mi
Series pipe ID: 4 6 4 in.
Segment lengths: 7 3 0 mi
Parallel pipe ID: 4 6 0 in.
Looped pipe ID: 4 6 4 in.
Segment lengths: 3 7 mi
Solution
Capacity improvement by series pipelines: ¼ 1.1668
s s
ffiffiffi ffiffiffiffiffiffiffiffiffiffiffiffiffiffiffiffiffiffiffiffiffiffiffiffiffi
2
2
3:23T b 1 p p D 5
1
2
q h ¼
T
p b f
g T zzL
Capacity improvement by parallel pipelines: ¼ 3.9483
Capacity improvement by looped pipelines: ¼ 1.1791
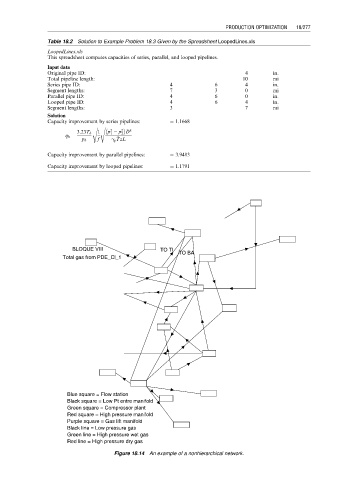
BLOQUE VIII TO TI
TO BA
Total gas from PDE_Cl_1
Blue square = Flow station
Black square = Low Pt entre manifold
Green square = Compressor plant
Red square = High pressure manifold
Purple square = Gas lift manifold
Black line = Low pressure gas
Green line = High pressure wet gas
Red line = High pressure dry gas
Figure 18.14 An example of a nonhierarchical network.