
Page 144 - Materials Chemistry, Second Edition
P. 144
Mass-Balance Concept and Reactor Design 127
1000
Concentration (mg/kg) 100
10
1
0 1 2 3 4 5 6
Time (hr)
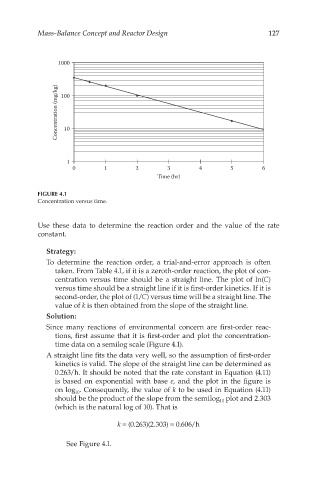
FIGURE 4.1
Concentration versus time.
Use these data to determine the reaction order and the value of the rate
constant.
Strategy:
To determine the reaction order, a trial-and-error approach is often
taken. From Table 4.1, if it is a zeroth-order reaction, the plot of con-
centration versus time should be a straight line. The plot of ln(C)
versus time should be a straight line if it is first-order kinetics. If it is
second-order, the plot of (1/C) versus time will be a straight line. The
value of k is then obtained from the slope of the straight line.
Solution:
Since many reactions of environmental concern are first-order reac-
tions, first assume that it is first-order and plot the concentration-
time data on a semilog scale (Figure 4.1).
A straight line fits the data very well, so the assumption of first-order
kinetics is valid. The slope of the straight line can be determined as
0.263/h. It should be noted that the rate constant in Equation (4.11)
is based on exponential with base e, and the plot in the figure is
on log . Consequently, the value of k to be used in Equation (4.11)
10
should be the product of the slope from the semilog plot and 2.303
10
(which is the natural log of 10). That is
k = (0.263)(2.303) = 0.606/h
See Figure 4.1.