
Page 241 - Materials Chemistry, Second Edition
P. 241
224 Practical Design Calculations for Groundwater and Soil Remediation
Y
Stagnation
point
Groundwater ow
X
Q/2Bu
Extraction
well Q/Bu
Q/2πBu
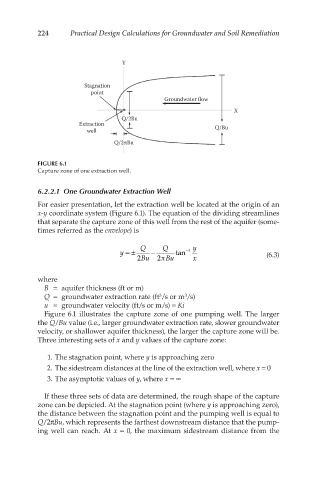
FIGURE 6.1
Capture zone of one extraction well.
6.2.2.1 One Groundwater Extraction Well
For easier presentation, let the extraction well be located at the origin of an
x-y coordinate system (Figure 6.1). The equation of the dividing streamlines
that separate the capture zone of this well from the rest of the aquifer (some-
times referred as the envelope) is
Q Q y
y =± − tan −1 (6.3)
2 Bu 2π Bu x
where
B = aquifer thickness (ft or m)
3
Q = groundwater extraction rate (ft /s or m /s)
3
u = groundwater velocity (ft/s or m/s) = Ki
Figure 6.1 illustrates the capture zone of one pumping well. The larger
the Q/Bu value (i.e., larger groundwater extraction rate, slower groundwater
velocity, or shallower aquifer thickness), the larger the capture zone will be.
Three interesting sets of x and y values of the capture zone:
1. The stagnation point, where y is approaching zero
2. The sidestream distances at the line of the extraction well, where x = 0
3. The asymptotic values of y, where x = ∞
If these three sets of data are determined, the rough shape of the capture
zone can be depicted. At the stagnation point (where y is approaching zero),
the distance between the stagnation point and the pumping well is equal to
Q/2πBu, which represents the farthest downstream distance that the pump-
ing well can reach. At x = 0, the maximum sidestream distance from the