
Page 243 - Materials Chemistry, Second Edition
P. 243
226 Practical Design Calculations for Groundwater and Soil Remediation
The following grid lists some of the data points used to plot
Figure 6.2.
y (ft) x (ft)
0 0.00
0.1 −13.74
1 −13.73
5 −13.14
10 −11.24
20 −2.34
30 21.01
40 168.78
–0.1 −13.74
–1 −13.73
–5 −13.14
–10 −11.24
–20 −2.34
–30 21.01
–40 168.78
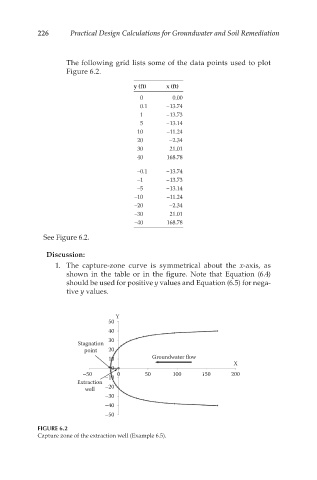
See Figure 6.2.
Discussion:
1. The capture-zone curve is symmetrical about the x-axis, as
shown in the table or in the figure. Note that Equation (6.4)
should be used for positive y values and Equation (6.5) for nega-
tive y values.
Y
50
40
30
Stagnation
point 20
10 Groundwater ow
X
0
–50 –10 0 50 100 150 200
Extraction
well –20
–30
–40
–50
FIGURE 6.2
Capture zone of the extraction well (Example 6.5).