
Page 249 - Materials Chemistry, Second Edition
P. 249
232 Practical Design Calculations for Groundwater and Soil Remediation
on the capture-zone curve is then copied to the plume map. One
may want to reduce the groundwater extraction rate to have
a smaller capture zone, but still sufficient to cover the entire
plume.
Step 5: If the capture zone cannot encompass the entire plume, pre-
pare the capture-zone curves using two or more pumping
wells until the capture zone can cover the entire plume. The
well locations on the capture-zone curve are then copied to
the plume map. Note that the zones of influence of individual
wells may overlap. One may not be able to pump the same flow
rate from each well in a network of wells as one can from a
single well with the same allowable drawdown.
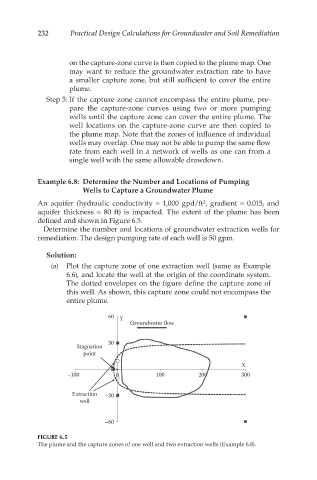
Example 6.8: Determine the Number and Locations of Pumping
Wells to Capture a Groundwater Plume
An aquifer (hydraulic conductivity = 1,000 gpd/ft , gradient = 0.015, and
2
aquifer thickness = 80 ft) is impacted. The extent of the plume has been
defined and shown in Figure 6.5.
Determine the number and locations of groundwater extraction wells for
remediation. The design pumping rate of each well is 50 gpm.
Solution:
(a) Plot the capture zone of one extraction well (same as Example
6.6), and locate the well at the origin of the coordinate system.
The dotted envelopes on the figure define the capture zone of
this well. As shown, this capture zone could not encompass the
entire plume.
60 Y
Groundwater ow
30
Stagnation
point
X
0
–100 0 100 200 300
Extraction –30
well
–60
FIGURE 6.5
The plume and the capture zones of one well and two extraction wells (Example 6.8).