
Page 406 -
P. 406
13.3
MEMBRANE PROCESSES
I I I
Micron
0.001 0,01 0.1 1.0 10 100 1000
Scale
Approx I I I
MW
100 200 1000 10,000 20~0 100,000 500,000
r r p
Dissolved Organics Sand
Size
T•agel
of
' i
Selected
Viruses =Giardia t
I I
Water
I ' I
I f
Constituents
fSaltsl r Colloidsl I t C~pt~"~iridium
Media Filtration
j I i
[ ~ - -::'-:."::'] Microfiltration
Membrane
Ultrafiltratmn
Process*
Nanofiltration
• Media Filtration (Net a Membrane Process)
-~'.-':~iit Reverse Osmosis is Shown for Reference Only,
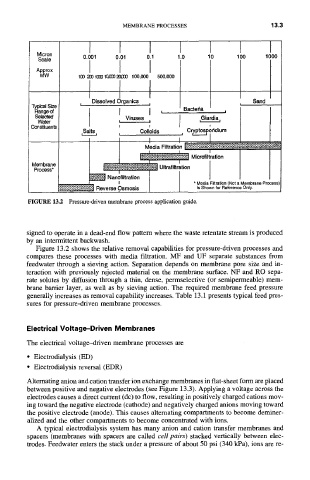
FIGURE 13.2 Pressure-driven membrane process application guide.
signed to operate in a dead-end flow pattern where the waste retentate stream is produced
by an intermittent backwash.
Figure 13.2 shows the relative removal capabilities for pressure-driven processes and
compares these processes with media filtration. MF and UF separate substances from
feedwater through a sieving action. Separation depends on membrane pore size and in-
teraction with previously rejected material on the membrane surface. NF and RO sepa-
rate solutes by diffusion through a thin, dense, permselective (or semipermeable) mem-
brane barrier layer, as well as by sieving action. The required membrane feed pressure
generally increases as removal capability increases. Table 13.1 presents typical feed pres-
sures for pressure-driven membrane processes.
Electrical Voltage-Driven Membranes
The electrical voltage-driven membrane processes are
• Electrodialysis (ED)
• Electrodialysis reversal (EDR)
Alternating anion and cation transfer ion exchange membranes in flat-sheet form are placed
between positive and negative electrodes (see Figure 13.3). Applying a voltage across the
electrodes causes a direct current (dc) to flow, resulting in positively charged cations mov-
ing toward the negative electrode (cathode) and negatively charged anions moving toward
the positive electrode (anode). This causes alternating compartments to become deminer-
alized and the other compartments to become concentrated with ions.
A typical electrodialysis system has many anion and cation transfer membranes and
spacers (membranes with spacers are called cell pairs) stacked vertically between elec-
trodes. Feedwater enters the stack under a pressure of about 50 psi (340 kPa), ions are re-