
Page 407 -
P. 407
13.4 CHAPTER THIRTEEN
TABLE 13.1 Typical Feed Pressures for Pressure-Driven Membrane
Processes
Typical feed pressure range
Membrane process psi kPa
Reverse osmosis
Brackish water application
Low pressure 125 to 300 860 to 2,070
Standard pressure 350 to 600 2,410 to 4,140
Seawater application 800 to 1,200 5,520 to 8,270
Nanofiltration 50 to 150 340 to 1,030
Ultrafiltration and microfiltration
Pressure type 3 to 50 21 to 340
Vacuum type - 1 to - 12 -7 to -83
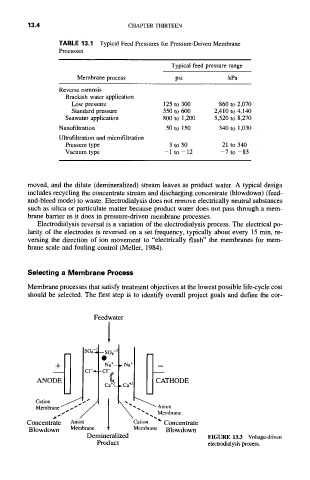
moved, and the dilute (demineralized) stream leaves as product water. A typical design
includes recycling the concentrate stream and discharging concentrate (blowdown) (feed-
and-bleed mode) to waste. Electrodialysis does not remove electrically neutral substances
such as silica or particulate matter because product water does not pass through a mem-
brane barrier as it does in pressure-driven membrane processes.
Electrodialysis reversal is a variation of the electrodialysis process. The electrical po-
larity of the electrodes is reversed on a set frequency, typically about every 15 min, re-
versing the direction of ion movement to "electrically flush" the membranes for mem-
brane scale and fouling control (Meller, 1984).
Selecting a Membrane Process
Membrane processes that satisfy treatment objectives at the lowest possible life-cycle cost
should be selected. The first step is to identify overall project goals and define the cor-
Feedwater
1
'504 ~
Na+ ~ --
+
__ Cl--~ - CI-~
ANODE
~a. 2 CATHODE
Ca+~-_~
Cation
Anion
Membrane ~S SS ~ s /
~S S ., Membrane
Concentrate Anion Cation "~" Concentrate
Blowdown Membrane Membrane Blowdown
Demineralized
FIGURE 13.3 Voltage-driven
Product
electrodialysis process.