
Page 261 - A Comprehensive Guide to Solar Energy Systems
P. 261
264 A COmPreHenSIVe GuIde TO SOlAr enerGy SySTemS
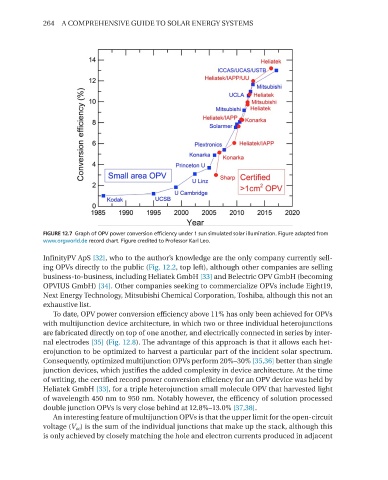
FIGURE 12.7 Graph of OPV power conversion efficiency under 1 sun simulated solar illumination. Figure adapted from
www.orgworld.de record chart. Figure credited to Professor Karl Leo.
InfinityPV ApS [32], who to the author’s knowledge are the only company currently sell-
ing OPVs directly to the public (Fig. 12.2, top left), although other companies are selling
business-to-business, including Heliatek GmbH [33] and Belectric OPV GmbH (becoming
OPVIuS GmbH) [34]. Other companies seeking to commercialize OPVs include eight19,
next energy Technology, mitsubishi Chemical Corporation, Toshiba, although this not an
exhaustive list.
To date, OPV power conversion efficiency above 11% has only been achieved for OPVs
with multijunction device architecture, in which two or three individual heterojunctions
are fabricated directly on top of one another, and electrically connected in series by inter-
nal electrodes [35] (Fig. 12.8). The advantage of this approach is that it allows each het-
erojunction to be optimized to harvest a particular part of the incident solar spectrum.
Consequently, optimized multijunction OPVs perform 20%–30% [35,36] better than single
junction devices, which justifies the added complexity in device architecture. At the time
of writing, the certified record power conversion efficiency for an OPV device was held by
Heliatek GmbH [33], for a triple heterojunction small molecule OPV that harvested light
of wavelength 450 nm to 950 nm. notably however, the efficency of solution processed
double junction OPVs is very close behind at 12.8%–13.0% [37,38].
An interesting feature of multijunction OPVs is that the upper limit for the open-circuit
voltage (V oc ) is the sum of the individual junctions that make up the stack, although this
is only achieved by closely matching the hole and electron currents produced in adjacent