
Page 31 - A Comprehensive Guide to Solar Energy Systems
P. 31
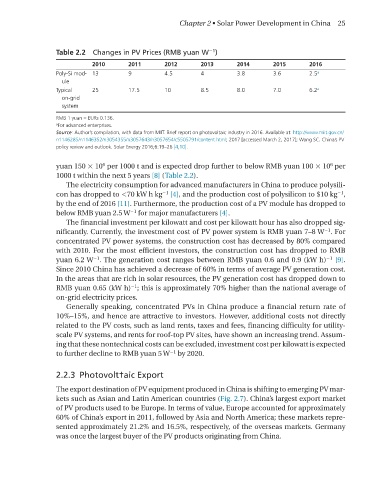
Chapter 2 • Solar Power Development in China  25


                 Table 2.2  Changes in PV Prices (RMB yuan W )
                                                           −1
                           2010      2011      2012      2013      2014      2015      2016
                 Poly-Si mod- 13     9         4.5       4         3.8       3.6       2.5 a
                  ule
                 Typical   25        17.5      10        8.5       8.0       7.0       6.2 a
                  on-grid
                  system
                 RMB 1 yuan = EURs 0.136.
                 a For advanced enterprises.
                 Source: Author’s compilation, with data from MIIT. Brief report on photovoltaic industry in 2016. Available at: http://www.miit.gov.cn/
                 n1146285/n1146352/n3054355/n3057643/n3057654/c5505791/content.html; 2017 [accessed March 2, 2017]; Wang SC. China’s PV
                 policy review and outlook. Solar Energy 2016;6:19–26 [4,10].

                                                                                             6
                 yuan 150 × 10  per 1000 t and is expected drop further to below rMB yuan 100 × 10  per
                              6
                 1000 t within the next 5 years [8] (Table 2.2).
                   The electricity consumption for advanced manufacturers in China to produce polysili-
                 con has dropped to <70 kW h kg  [4], and the production cost of polysilicon to $10 kg ,
                                                                                               −1
                                              −1
                 by the end of 2016 [11]. Furthermore, the production cost of a PV module has dropped to
                 below rMB yuan 2.5 W  for major manufacturers [4].
                                     −1
                   The financial investment per kilowatt and cost per kilowatt hour has also dropped sig-
                 nificantly. Currently, the investment cost of PV power system is rMB yuan 7–8 W . For
                                                                                           −1
                 concentrated PV power systems, the construction cost has decreased by 80% compared
                 with 2010. For the most efficient investors, the construction cost has dropped to rMB
                 yuan 6.2 W . The generation cost ranges between rMB yuan 0.6 and 0.9 (kW h)  [9].
                           −1
                                                                                            −1
                 Since 2010 China has achieved a decrease of 60% in terms of average PV generation cost.
                 In the areas that are rich in solar resources, the PV generation cost has dropped down to
                 rMB yuan 0.65 (kW h) ; this is approximately 70% higher than the national average of
                                     −1
                 on-grid electricity prices.
                   Generally speaking, concentrated PVs in China produce a financial return rate of
                 10%–15%, and hence are attractive to investors. However, additional costs not directly
                 related to the PV costs, such as land rents, taxes and fees, financing difficulty for utility-
                 scale PV systems, and rents for roof-top PV sites, have shown an increasing trend. Assum-
                 ing that these nontechnical costs can be excluded, investment cost per kilowatt is expected
                                                −1
                 to further decline to rMB yuan 5 W  by 2020.
                 2.2.3  Photovolt†aic Export

                 The export destination of PV equipment produced in China is shifting to emerging PV mar-
                 kets such as Asian and latin American countries (Fig. 2.7). China’s largest export market
                 of PV products used to be Europe. In terms of value, Europe accounted for approximately
                 60% of China’s export in 2011, followed by Asia and North America; these markets repre-
                 sented approximately 21.2% and 16.5%, respectively, of the overseas markets.  Germany
                 was once the largest buyer of the PV products originating from China.