
Page 34 - A Comprehensive Guide to Solar Energy Systems
P. 34
28 A COMPrEHENSIVE GUIDE TO SOlAr ENErGY SYSTEMS
As of the end of 2016, seven batches of solar and wind power projects, totaled 89.14 GW,
were granted subsidies by the Ministry of Finance. At the same time, the installed capac-
ity of solar and wind power totaled 226 GW, which implies only approximately 40% of
these projects gained subsidies. Moreover, the subsidies to renewable energy were often
in arrears by months. Obviously, there has been a huge imbalance between the revenue
available and the funds demanded for renewable energy. Currently, the estimated gap
between the needed subsidies and available funds for renewable energy is about rMB
9
yuan 3050 × 10 . The problem of funding deficit might become more intense with the rap-
idly growing size of renewable energy.
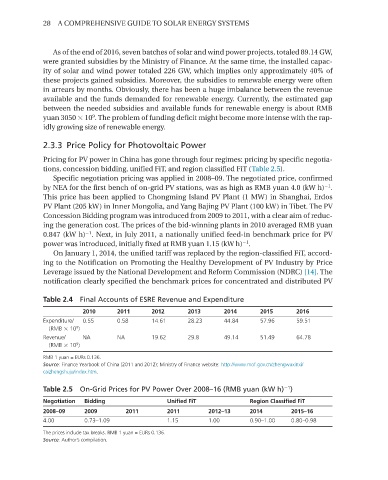
2.3.3 Price Policy for Photovoltaic Power
Pricing for PV power in China has gone through four regimes: pricing by specific negotia-
tions, concession bidding, unified FiT, and region classified FiT (Table 2.5).
Specific negotiation pricing was applied in 2008–09. The negotiated price, confirmed
−1
by NEA for the first bench of on-grid PV stations, was as high as rMB yuan 4.0 (kW h) .
This price has been applied to Chongming Island PV Plant (1 MW) in Shanghai, Erdos
PV Plant (205 kW) in Inner Mongolia, and Yang Bajing PV Plant (100 kW) in Tibet. The PV
Concession Bidding program was introduced from 2009 to 2011, with a clear aim of reduc-
ing the generation cost. The prices of the bid-winning plants in 2010 averaged rMB yuan
−1
0.847 (kW h) . Next, in July 2011, a nationally unified feed-in benchmark price for PV
−1
power was introduced, initially fixed at rMB yuan 1.15 (kW h) .
On January 1, 2014, the unified tariff was replaced by the region-classified FiT, accord-
ing to the Notification on Promoting the Healthy Development of PV Industry by Price
leverage issued by the National Development and reform Commission (NDrC) [14]. The
notification clearly specified the benchmark prices for concentrated and distributed PV
Table 2.4 Final Accounts of ESRE Revenue and Expenditure
2010 2011 2012 2013 2014 2015 2016
Expenditure/ 0.55 0.58 14.61 28.23 44.84 57.96 59.51
(RMB × 10 )
9
Revenue/ NA NA 19.62 29.8 49.14 51.49 64.78
9
(RMB × 10 )
RMB 1 yuan = EURs 0.136.
Source: Finance Yearbook of China (2011 and 2012); Ministry of Finance website: http://www.mof.gov.cn/zhengwuxinxi/
caizhengshuju/index.htm.
−1
Table 2.5 On-Grid Prices for PV Power Over 2008–16 (RMB yuan (kW h) )
Negotiation Bidding Unified FiT Region Classified FiT
2008–09 2009 2011 2011 2012–13 2014 2015–16
4.00 0.73–1.09 1.15 1.00 0.90–1.00 0.80–0.98
The prices include tax breaks. RMB 1 yuan = EURs 0.136.
Source: Author’s compilation.