
Page 32 - A Comprehensive Guide to Solar Energy Systems
P. 32
26 A COMPrEHENSIVE GUIDE TO SOlAr ENErGY SYSTEMS
Europe reductions in the subsides for solar power, combined with the AD and CVDs,
have resulted in a slump in China’s export to its traditional PV markets, such as Germany,
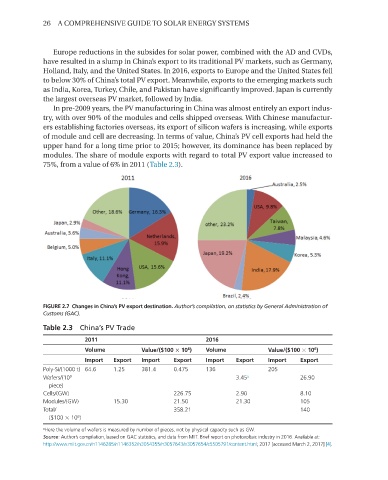
Holland, Italy, and the United States. In 2016, exports to Europe and the United States fell
to below 30% of China’s total PV export. Meanwhile, exports to the emerging markets such
as India, Korea, Turkey, Chile, and Pakistan have significantly improved. Japan is currently
the largest overseas PV market, followed by India.
In pre-2009 years, the PV manufacturing in China was almost entirely an export indus-
try, with over 90% of the modules and cells shipped overseas. With Chinese manufactur-
ers establishing factories overseas, its export of silicon wafers is increasing, while exports
of module and cell are decreasing. In terms of value, China’s PV cell exports had held the
upper hand for a long time prior to 2015; however, its dominance has been replaced by
modules. The share of module exports with regard to total PV export value increased to
75%, from a value of 6% in 2011 (Table 2.3).
FIGURE 2.7 Changes in China’s PV export destination. Author’s compilation, on statistics by General Administration of
Customs (GAC).
Table 2.3 China’s PV Trade
2011 2016
Volume Value/($100 × 10 ) Volume Value/($100 × 10 )
6
6
Import Export Import Export Import Export Import Export
Poly-Si/(1000 t) 64.6 1.25 381.4 0.475 136 205
9
Wafers/(10 3.45 a 26.90
piece)
Cells/(GW) 226.75 2.90 8.10
Modules/(GW) 15.30 21.50 21.30 105
Total/ 358.21 140
($100 × 10 )
6
a Here the volume of wafers is measured by number of pieces, not by physical capacity such as GW.
Source: Author’s compilation, based on GAC statistics, and data from MIIT. Brief report on photovoltaic industry in 2016. Available at:
http://www.miit.gov.cn/n1146285/n1146352/n3054355/n3057643/n3057654/c5505791/content.html; 2017 [accessed March 2, 2017] [4].