
Page 153 - A First Course In Stochastic Models
P. 153
146 CONTINUOUS-TIME MARKOV CHAINS
l l l
0 1 • • • i − 1 i • • • Q − 1 Q
m
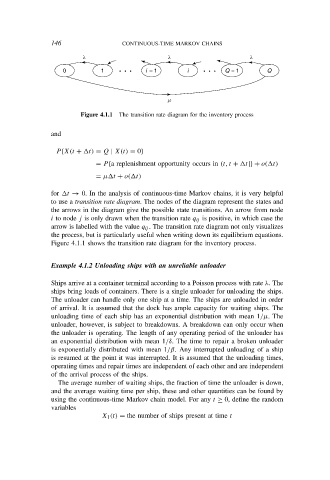
Figure 4.1.1 The transition rate diagram for the inventory process
and
P {X(t + t) = Q | X(t) = 0}
= P {a replenishment opportunity occurs in (t, t + t]} + o( t)
= µ t + o( t)
for t → 0. In the analysis of continuous-time Markov chains, it is very helpful
to use a transition rate diagram. The nodes of the diagram represent the states and
the arrows in the diagram give the possible state transitions. An arrow from node
i to node j is only drawn when the transition rate q ij is positive, in which case the
arrow is labelled with the value q ij . The transition rate diagram not only visualizes
the process, but is particularly useful when writing down its equilibrium equations.
Figure 4.1.1 shows the transition rate diagram for the inventory process.
Example 4.1.2 Unloading ships with an unreliable unloader
Ships arrive at a container terminal according to a Poisson process with rate λ. The
ships bring loads of containers. There is a single unloader for unloading the ships.
The unloader can handle only one ship at a time. The ships are unloaded in order
of arrival. It is assumed that the dock has ample capacity for waiting ships. The
unloading time of each ship has an exponential distribution with mean 1/µ. The
unloader, however, is subject to breakdowns. A breakdown can only occur when
the unloader is operating. The length of any operating period of the unloader has
an exponential distribution with mean 1/δ. The time to repair a broken unloader
is exponentially distributed with mean 1/β. Any interrupted unloading of a ship
is resumed at the point it was interrupted. It is assumed that the unloading times,
operating times and repair times are independent of each other and are independent
of the arrival process of the ships.
The average number of waiting ships, the fraction of time the unloader is down,
and the average waiting time per ship, these and other quantities can be found by
using the continuous-time Markov chain model. For any t ≥ 0, define the random
variables
X 1 (t) = the number of ships present at time t