
Page 397 - A First Course In Stochastic Models
P. 397
392 ALGORITHMIC ANALYSIS OF QUEUEING MODELS
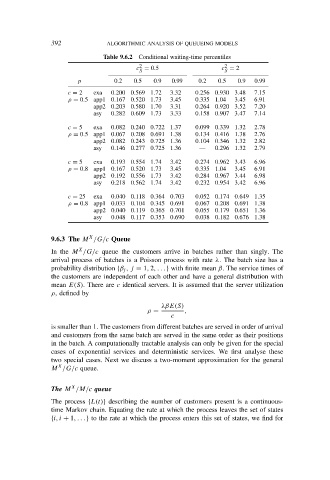
Table 9.6.2 Conditional waiting-time percentiles
2
2
c = 0.5 c = 2
S S
p 0.2 0.5 0.9 0.99 0.2 0.5 0.9 0.99
c = 2 exa 0.200 0.569 1.72 3.32 0.256 0.930 3.48 7.15
ρ = 0.5 app1 0.167 0.520 1.73 3.45 0.335 1.04 3.45 6.91
app2 0.203 0.580 1.70 3.31 0.264 0.920 3.52 7.20
asy 0.282 0.609 1.73 3.33 0.158 0.907 3.47 7.14
c = 5 exa 0.082 0.240 0.722 1.37 0.099 0.339 1.32 2.78
ρ = 0.5 app1 0.067 0.208 0.691 1.38 0.134 0.416 1.38 2.76
app2 0.082 0.243 0.725 1.36 0.104 0.346 1.32 2.82
asy 0.146 0.277 0.725 1.36 — 0.296 1.32 2.79
c = 5 exa 0.193 0.554 1.74 3.42 0.274 0.962 3.43 6.96
ρ = 0.8 app1 0.167 0.520 1.73 3.45 0.335 1.04 3.45 6.91
app2 0.192 0.556 1.73 3.42 0.284 0.967 3.44 6.98
asy 0.218 0.562 1.74 3.42 0.232 0.954 3.42 6.96
c = 25 exa 0.040 0.118 0.364 0.703 0.052 0.174 0.649 1.35
ρ = 0.8 app1 0.033 0.104 0.345 0.691 0.067 0.208 0.691 1.38
app2 0.040 0.119 0.365 0.701 0.055 0.179 0.651 1.36
asy 0.048 0.117 0.353 0.690 0.038 0.182 0.676 1.38
X
9.6.3 The M /G/c Queue
X
In the M /G/c queue the customers arrive in batches rather than singly. The
arrival process of batches is a Poisson process with rate λ. The batch size has a
probability distribution {β j , j = 1, 2, . . . } with finite mean β. The service times of
the customers are independent of each other and have a general distribution with
mean E(S). There are c identical servers. It is assumed that the server utilization
ρ, defined by
λβE(S)
ρ = ,
c
is smaller than 1. The customers from different batches are served in order of arrival
and customers from the same batch are served in the same order as their positions
in the batch. A computationally tractable analysis can only be given for the special
cases of exponential services and deterministic services. We first analyse these
two special cases. Next we discuss a two-moment approximation for the general
X
M /G/c queue.
X
The M /M/c queue
The process {L(t)} describing the number of customers present is a continuous-
time Markov chain. Equating the rate at which the process leaves the set of states
{i, i + 1, . . . } to the rate at which the process enters this set of states, we find for