
Page 357 -
P. 357
11 - PROJECT RISK MANAGEMENT
11.3.2.2 Probability and Impact Matrix
Risks can be prioritized for further quantitative analysis and planning risk responses based on their risk rating.
Ratings are assigned to risks based on their assessed probability and impact. Evaluation of each risk’s importance
and priority for attention is typically conducted using a look-up table or a probability and impact matrix. Such a
matrix specifies combinations of probability and impact that lead to rating the risks as low, moderate, or high
priority. Descriptive terms or numeric values can be used depending on organizational preference.
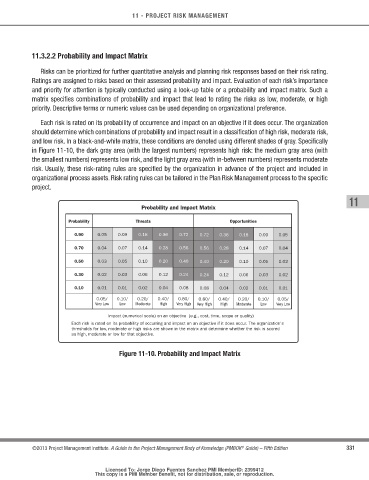
Each risk is rated on its probability of occurrence and impact on an objective if it does occur. The organization
should determine which combinations of probability and impact result in a classification of high risk, moderate risk,
and low risk. In a black-and-white matrix, these conditions are denoted using different shades of gray. Specifically
in Figure 11-10, the dark gray area (with the largest numbers) represents high risk: the medium gray area (with
the smallest numbers) represents low risk, and the light gray area (with in-between numbers) represents moderate
risk. Usually, these risk-rating rules are specified by the organization in advance of the project and included in
organizational process assets. Risk rating rules can be tailored in the Plan Risk Management process to the specific
project.
11
Probability and Impact Matrix
Probability Threats Opportunities
0.90 0.05 0.09 0.18 0.36 0.72 0.72 0.36 0.18 0.09 0.05
0.70 0.04 0.07 0.14 0.28 0.56 0.56 0.28 0.14 0.07 0.04
0.50 0.03 0.05 0.10 0.20 0.40 0.40 0.20 0.10 0.05 0.03
0.30 0.02 0.03 0.06 0.12 0.24 0.24 0.12 0.06 0.03 0.02
0.10 0.01 0.01 0.02 0.04 0.08 0.08 0.04 0.02 0.01 0.01
0.05/ 0.10/ 0.20/ 0.40/ 0.80/ 0.80/ 0.40/ 0.20/ 0.10/ 0.05/
Very Low Low Moderate High Very High Very High High Moderate Low Very Low
Impact (numerical scale) on an objective (e.g., cost, time, scope or quality)
Each risk is rated on its probability of occurring and impact on an objective if it does occur. The organization's
thresholds for low, moderate or high risks are shown in the matrix and determine whether the risk is scored
as high, moderate or low for that objective.
Figure 11-10. Probability and Impact Matrix
®
©2013 Project Management Institute. A Guide to the Project Management Body of Knowledge (PMBOK Guide) – Fifth Edition 331
Licensed To: Jorge Diego Fuentes Sanchez PMI MemberID: 2399412
This copy is a PMI Member benefit, not for distribution, sale, or reproduction.