
Page 362 -
P. 362
11 - PROJECT RISK MANAGEMENT
11.4.1.6 organizational Process Assets
Described in Section 2.1.4. The organizational process assets that can influence the Perform Quantitative Risk
Analysis process include information from prior, similar completed projects.
11.4.2 Perform Quantitative risk Analysis: tools and techniques
11.4.2.1 data Gathering and representation techniques
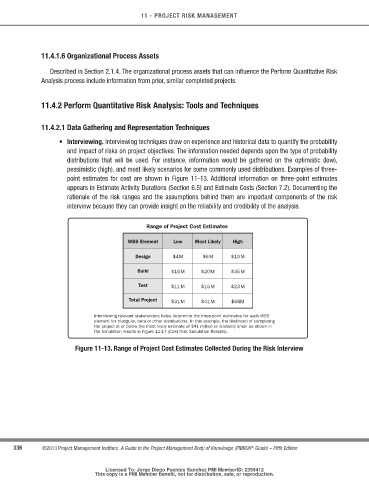
• Interviewing. Interviewing techniques draw on experience and historical data to quantify the probability
and impact of risks on project objectives. The information needed depends upon the type of probability
distributions that will be used. For instance, information would be gathered on the optimistic (low),
pessimistic (high), and most likely scenarios for some commonly used distributions. Examples of three-
point estimates for cost are shown in Figure 11-13. Additional information on three-point estimates
appears in Estimate Activity Durations (Section 6.5) and Estimate Costs (Section 7.2). Documenting the
rationale of the risk ranges and the assumptions behind them are important components of the risk
interview because they can provide insight on the reliability and credibility of the analysis.
Range of Project Cost Estimates
WBS Element Low Most Likely High
Design $4M $6M $10M
Build $16M $20M $35M
Test $11M $15M $23M
Total Project $31M $41M $68M
Interviewing relevant stakeholders helps determine the three-point estimates for each WBS
element for triangular, beta or other distributions. In this example, the likelihood of completing
the project at or below the most likely estimate of $41 million is relatively small as shown in
the simulation results in Figure 11-17 (Cost Risk Simulation Results).
Figure 11-13. range of Project cost Estimates collected during the risk Interview
336 ©2013 Project Management Institute. A Guide to the Project Management Body of Knowledge (PMBOK Guide) – Fifth Edition
®
Licensed To: Jorge Diego Fuentes Sanchez PMI MemberID: 2399412
This copy is a PMI Member benefit, not for distribution, sale, or reproduction.