
Page 365 -
P. 365
11 - PROJECT RISK MANAGEMENT
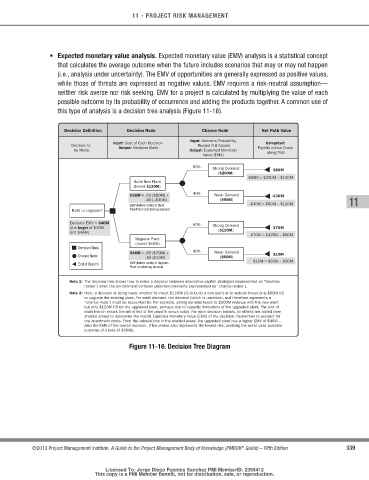
• Expected monetary value analysis. Expected monetary value (EMV) analysis is a statistical concept
that calculates the average outcome when the future includes scenarios that may or may not happen
(i.e., analysis under uncertainty). The EMV of opportunities are generally expressed as positive values,
while those of threats are expressed as negative values. EMV requires a risk-neutral assumption—
neither risk averse nor risk seeking. EMV for a project is calculated by multiplying the value of each
possible outcome by its probability of occurrence and adding the products together. A common use of
this type of analysis is a decision tree analysis (Figure 11-16).
Decision Definition Decision Node Chance Node Net Path Value
Input: Scenario Probability,
Input: Cost of Each Decision Computed:
Decision to Output: Decision Made Reward if it Occurs Payoffs minus Costs
be Made Output: Expected Monetary along Path
Value (EMV)
60% Strong Demand $80M
($200M)
$80M = $200M – $120M
Build New Plant
(Invest $120M)
$36M = .60 ($80M) + 40% Weak Demand -$30M
.40 (–$30M) ($90M) 11
EMV (before costs) of Build –$30M = $90M – $120M
Build or Upgrade? New Plant considering demand
Decision EMV = $46M 60%
(the larger of $36M Strong Demand $70M
and $46M) ($120M)
$70M = $120M – $50M
Upgrade Plant
(Invest $50M)
Decision Node
$46M = .60 ($70M) + 40% Weak Demand
Chance Node .40 ($10M) ($60M) $10M
End of Branch EMV (before costs) of Upgrade $10M = $60M – $50M
Plant considering demand
Note 1: The decision tree shows how to make a decision between alternative capital strategies (represented as “decision
nodes”) when the environment contains uncertain elements (represented as “chance nodes”).
Note 2: Here, a decision is being made whether to invest $120M US to build a new plant or to instead invest only $50M US
to upgrade the existing plant. For each decision, the demand (which is uncertain, and therefore represents a
“chance node”) must be accounted for. For example, strong demand leads to $200M revenue with the new plant
but only $120M US for the upgraded plant, perhaps due to capacity limitations of the upgraded plant. The end of
each branch shows the net effect of the payoffs minus costs. For each decision branch, all effects are added (see
shaded areas) to determine the overall Expected Monetary Value (EMV) of the decision. Remember to account for
the investment costs. From the calculations in the shaded areas, the upgraded plant has a higher EMV of $46M –
also the EMV of the overall decision. (This choice also represents the lowest risk, avoiding the worst case possible
outcome of a loss of $30M).
Figure 11-16. decision tree diagram
©2013 Project Management Institute. A Guide to the Project Management Body of Knowledge (PMBOK Guide) – Fifth Edition 339
®
Licensed To: Jorge Diego Fuentes Sanchez PMI MemberID: 2399412
This copy is a PMI Member benefit, not for distribution, sale, or reproduction.