
Page 363 -
P. 363
11 - PROJECT RISK MANAGEMENT
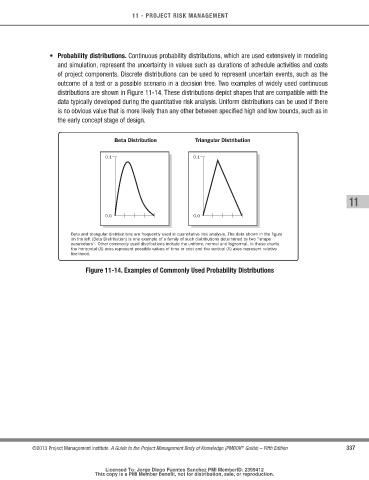
• Probability distributions. Continuous probability distributions, which are used extensively in modeling
and simulation, represent the uncertainty in values such as durations of schedule activities and costs
of project components. Discrete distributions can be used to represent uncertain events, such as the
outcome of a test or a possible scenario in a decision tree. Two examples of widely used continuous
distributions are shown in Figure 11-14. These distributions depict shapes that are compatible with the
data typically developed during the quantitative risk analysis. Uniform distributions can be used if there
is no obvious value that is more likely than any other between specified high and low bounds, such as in
the early concept stage of design.
Beta Distribution Triangular Distribution
0.1 0.1
11
0.0 0.0
Beta and triangular distributions are frequently used in quantitative risk analysis. The data shown in the figure
on the left (Beta Distribution) is one example of a family of such distributions determined by two "shape
parameters". Other commonly used distributions include the uniform, normal and lognormal. In these charts
the horizontal (X) axes represent possible values of time or cost and the vertical (Y) axes represent relative
likelihood.
Figure 11-14. Examples of commonly used Probability distributions
©2013 Project Management Institute. A Guide to the Project Management Body of Knowledge (PMBOK Guide) – Fifth Edition 337
®
Licensed To: Jorge Diego Fuentes Sanchez PMI MemberID: 2399412
This copy is a PMI Member benefit, not for distribution, sale, or reproduction.