
Page 364 -
P. 364
11 - PROJECT RISK MANAGEMENT
11.4.2.2 Quantitative risk Analysis and Modeling techniques
Commonly used techniques use both event-oriented and project-oriented analysis approaches, including:
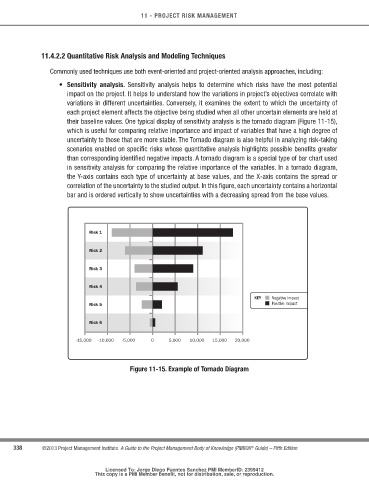
• Sensitivity analysis. Sensitivity analysis helps to determine which risks have the most potential
impact on the project. It helps to understand how the variations in project’s objectives correlate with
variations in different uncertainties. Conversely, it examines the extent to which the uncertainty of
each project element affects the objective being studied when all other uncertain elements are held at
their baseline values. One typical display of sensitivity analysis is the tornado diagram (Figure 11-15),
which is useful for comparing relative importance and impact of variables that have a high degree of
uncertainty to those that are more stable. The Tornado diagram is also helpful in analyzing risk-taking
scenarios enabled on specific risks whose quantitative analysis highlights possible benefits greater
than corresponding identified negative impacts. A tornado diagram is a special type of bar chart used
in sensitivity analysis for comparing the relative importance of the variables. In a tornado diagram,
the Y-axis contains each type of uncertainty at base values, and the X-axis contains the spread or
correlation of the uncertainty to the studied output. In this figure, each uncertainty contains a horizontal
bar and is ordered vertically to show uncertainties with a decreasing spread from the base values.
Risk 1
Risk 2
Risk 3
Risk 4
KEY Negative Impact
Risk 5 Positive Impact
Risk 6
-15,000 -10,000 -5,000 0 5,000 10,000 15,000 20,000
Figure 11-15. Example of tornado diagram
338 ©2013 Project Management Institute. A Guide to the Project Management Body of Knowledge (PMBOK Guide) – Fifth Edition
®
Licensed To: Jorge Diego Fuentes Sanchez PMI MemberID: 2399412
This copy is a PMI Member benefit, not for distribution, sale, or reproduction.