
Page 366 -
P. 366
11 - PROJECT RISK MANAGEMENT
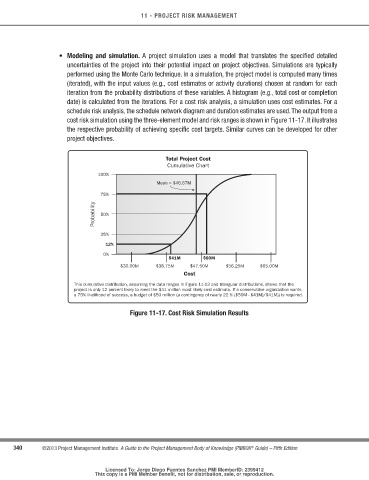
• Modeling and simulation. A project simulation uses a model that translates the specified detailed
uncertainties of the project into their potential impact on project objectives. Simulations are typically
performed using the Monte Carlo technique. In a simulation, the project model is computed many times
(iterated), with the input values (e.g., cost estimates or activity durations) chosen at random for each
iteration from the probability distributions of these variables. A histogram (e.g., total cost or completion
date) is calculated from the iterations. For a cost risk analysis, a simulation uses cost estimates. For a
schedule risk analysis, the schedule network diagram and duration estimates are used. The output from a
cost risk simulation using the three-element model and risk ranges is shown in Figure 11-17. It illustrates
the respective probability of achieving specific cost targets. Similar curves can be developed for other
project objectives.
Total Project Cost
Cumulative Chart
100%
Mean = $46.67M
75%
Probability 50%
25%
12%
0%
$41M $50M
$30.00M $38.75M $47.50M $56.25M $65.00M
Cost
This cumulative distribution, assuming the data ranges in Figure 11-13 and triangular distributions, shows that the
project is only 12 percent likely to meet the $41 million most likely cost estimate. If a conservative organization wants
a 75% likelihood of success, a budget of $50 million (a contingency of nearly 22 % ($50M - $41M)/$41M)) is required.
Figure 11-17. cost risk Simulation results
340 ©2013 Project Management Institute. A Guide to the Project Management Body of Knowledge (PMBOK Guide) – Fifth Edition
®
Licensed To: Jorge Diego Fuentes Sanchez PMI MemberID: 2399412
This copy is a PMI Member benefit, not for distribution, sale, or reproduction.