Page 22 - A Practical Companion to Reservoir Stimulation
P. 22

RESERVOIR AND WELL CONSIDERATIONS


            EXAMPLE A-4
            Forecast of Transient Well Performance               With the variables given and calculated in Example A- 1, Eq.
                                                                 A- 13 reduces to (before stimulation)

            Assuming that the bottomhole pressure for the well analyzed               1584
            in Example A- 1 is 750 psi, construct a 1 80-day deliverability   4=   log  r +  10.03'        (A-14)
            curve both before and after acidizing (assume that s = 0 after
            stimulation).                                        and (after stimulation, s = 0)

            Solution (Ref. Section 1-2.1)                                             1584
                                                                               4=                          (A-15)
            Equation  1 - 13 can be rearranged as                                  log  t  + 3.04
                                                                   (Note that in Eqs. A-14 and A-15, the time, t, must be in
                 kh (Pi - Pwf)
            4=                                                   hours.)
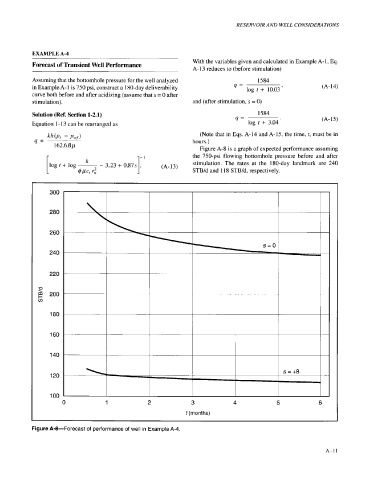
                   162.6 Bp                                        Figure A-8 is a graph of expected performance assuming
                             k                1'                 the  750-psi  flowing bottomhole  pressure  before  and  after
                                                                 stimulation. The  rates  at  the  180-day  landmark  are  240
                           4w, 6.                                STB/d and 1 18 STB/d, respectively.
                 log t + log  ~   - 3.23 + 0.87s  .   (A-13)


                  300


                  280


                 260


                 240


                 220


                 200


                  180


                  160


                  140


                                                                                               s = +8
                  120


                  100
                      0             1             2             3             4              5            6
                                                               t (months)


            Figure A-8-Forecast  of performance of well in Example A-4.


                                                                                                             A-1  1
   17   18   19   20   21   22   23   24   25   26   27