
Page 51 - A Practical Companion to Reservoir Stimulation
P. 51
PRACTICAL COMPANION TO RESERVOIR STIMULATION
EXAMPLE D-2
k
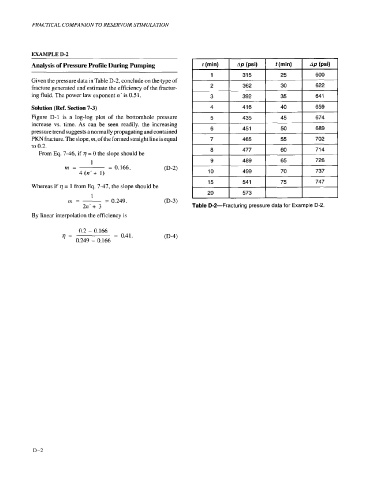
Analysis of Pressure Profile During Pumping t (min)
Given the pressure data in Table D-2, conclude on the type of
fracture generated and estimate the efficiency of the fractur-
ing fluid. The power law exponent n’ is 0.5 1.
Solution (Ref. Section 7-3)
Figure D-1 is a log-log plot of the bottomhole pressure p 6
increase vs. time. As can be seen readily, the increasing
pressure trend suggests a normally propagating and contained
PKN fracture. The slope, m, of the formed straight line is equal
to 0.2.
From Eq. 7-46, if q = 0 the slope should be ‘
1
m= = 0.166. 0-2)
4 (n’+ 1)
Whereas if q = 1 from Eq. 7-47, the slope should be
1 20
m = ~ = 0.249. (D-3)
2n’+ 3 Table D-2-Fr a icturing pressure data for Example D-2.
By linear interpolation the efficiency is
0.2 - 0.166
17= = 0.41.
0.249 - 0.166
D-2