
Page 52 - A Practical Companion to Reservoir Stimulation
P. 52
2
I
I
7 8090 100 70 60 50 40 30 20 8910 Time (min)
Y I I 6
-F 5 4
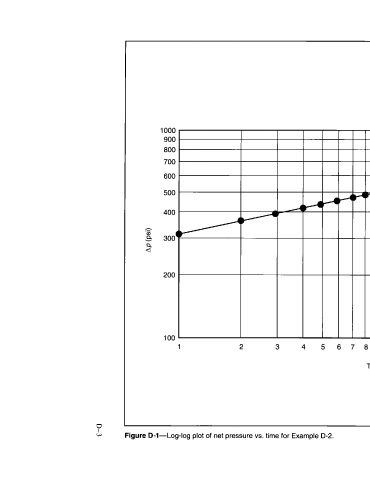
3 plot of net pressure vs. time for Example D-2.
2
1
1000 900 800 700 600 500 400 300' 200 100
I=' (I) Q v 4 d Figure D-1-Log-log
P W