
Page 92 - Accounting Information Systems
P. 92
CHAPT E R 2 Introduction to Transaction Processing 63
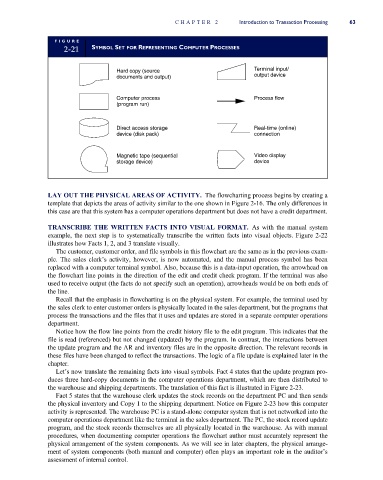
FI G U R E
2-21 SYMBOL SET FOR REPRESENTING COMPUTER PROCESSES
Hard copy (source Terminal input/
documents and output) output device
Computer process Process flow
(program run)
Direct access storage Real-time (online)
device (disk pack) connection
Magnetic tape (sequential Video display
storage device) device
LAY OUT THE PHYSICAL AREAS OF ACTIVITY. The flowcharting process begins by creating a
template that depicts the areas of activity similar to the one shown in Figure 2-16. The only differences in
this case are that this system has a computer operations department but does not have a credit department.
TRANSCRIBE THE WRITTEN FACTS INTO VISUAL FORMAT. As with the manual system
example, the next step is to systematically transcribe the written facts into visual objects. Figure 2-22
illustrates how Facts 1, 2, and 3 translate visually.
The customer, customer order, and file symbols in this flowchart are the same as in the previous exam-
ple. The sales clerk’s activity, however, is now automated, and the manual process symbol has been
replaced with a computer terminal symbol. Also, because this is a data-input operation, the arrowhead on
the flowchart line points in the direction of the edit and credit check program. If the terminal was also
used to receive output (the facts do not specify such an operation), arrowheads would be on both ends of
the line.
Recall that the emphasis in flowcharting is on the physical system. For example, the terminal used by
the sales clerk to enter customer orders is physically located in the sales department, but the programs that
process the transactions and the files that it uses and updates are stored in a separate computer operations
department.
Notice how the flow line points from the credit history file to the edit program. This indicates that the
file is read (referenced) but not changed (updated) by the program. In contrast, the interactions between
the update program and the AR and inventory files are in the opposite direction. The relevant records in
these files have been changed to reflect the transactions. The logic of a file update is explained later in the
chapter.
Let’s now translate the remaining facts into visual symbols. Fact 4 states that the update program pro-
duces three hard-copy documents in the computer operations department, which are then distributed to
the warehouse and shipping departments. The translation of this fact is illustrated in Figure 2-23.
Fact 5 states that the warehouse clerk updates the stock records on the department PC and then sends
the physical inventory and Copy 1 to the shipping department. Notice on Figure 2-23 how this computer
activity is represented. The warehouse PC is a stand-alone computer system that is not networked into the
computer operations department like the terminal in the sales department. The PC, the stock record update
program, and the stock records themselves are all physically located in the warehouse. As with manual
procedures, when documenting computer operations the flowchart author must accurately represent the
physical arrangement of the system components. As we will see in later chapters, the physical arrange-
ment of system components (both manual and computer) often plays an important role in the auditor’s
assessment of internal control.