
Page 87 - Accounting Information Systems
P. 87
58 PART I Overview of Accounting Information Systems
LAY OUT THE PHYSICAL AREAS OF ACTIVITY. Remember that a flowchart reflects the physi-
cal system, which is represented as vertical columns of events and actions separated by lines of demarca-
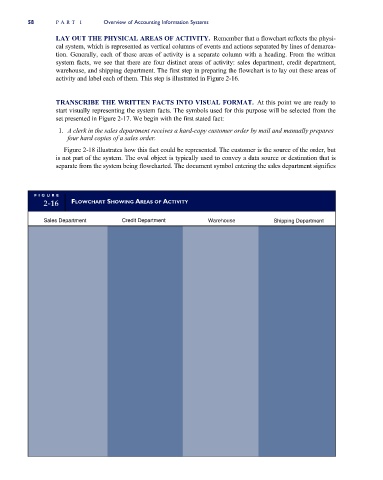
tion. Generally, each of these areas of activity is a separate column with a heading. From the written
system facts, we see that there are four distinct areas of activity: sales department, credit department,
warehouse, and shipping department. The first step in preparing the flowchart is to lay out these areas of
activity and label each of them. This step is illustrated in Figure 2-16.
TRANSCRIBE THE WRITTEN FACTS INTO VISUAL FORMAT. At this point we are ready to
start visually representing the system facts. The symbols used for this purpose will be selected from the
set presented in Figure 2-17. We begin with the first stated fact:
1. A clerk in the sales department receives a hard-copy customer order by mail and manually prepares
four hard copies of a sales order.
Figure 2-18 illustrates how this fact could be represented. The customer is the source of the order, but
is not part of the system. The oval object is typically used to convey a data source or destination that is
separate from the system being flowcharted. The document symbol entering the sales department signifies
FI G U R E
2-16 FLOWCHART SHOWING AREAS OF ACTIVITY
Sales Department Credit Department Warehouse Shipping Department