
Page 85 - Accounting Information Systems
P. 85
56 PART I Overview of Accounting Information Systems
FI GU RE
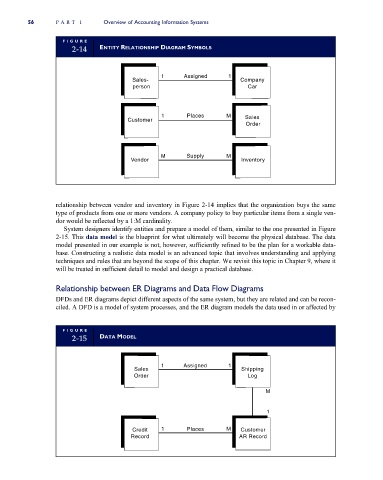
2-14 ENTITY RELATIONSHIP DIAGRAM SYMBOLS
1 Assigned 1
Sales- Company
person Car
1 Places M Sales
Customer
Order
M Supply M
Vendor Inventory
relationship between vendor and inventory in Figure 2-14 implies that the organization buys the same
type of products from one or more vendors. A company policy to buy particular items from a single ven-
dor would be reflected by a 1:M cardinality.
System designers identify entities and prepare a model of them, similar to the one presented in Figure
2-15. This data model is the blueprint for what ultimately will become the physical database. The data
model presented in our example is not, however, sufficiently refined to be the plan for a workable data-
base. Constructing a realistic data model is an advanced topic that involves understanding and applying
techniques and rules that are beyond the scope of this chapter. We revisit this topic in Chapter 9, where it
will be treated in sufficient detail to model and design a practical database.
Relationship between ER Diagrams and Data Flow Diagrams
DFDs and ER diagrams depict different aspects of the same system, but they are related and can be recon-
ciled. A DFD is a model of system processes, and the ER diagram models the data used in or affected by
FI GU RE
2-15 DATA MODEL
1 Assigned 1
Sales Shipping
Order Log
M
1
Credit 1 Places M Customer
Record AR Record