
Page 84 - Accounting Information Systems
P. 84
CHAPT E R 2 Introduction to Transaction Processing 55
FI G U R E
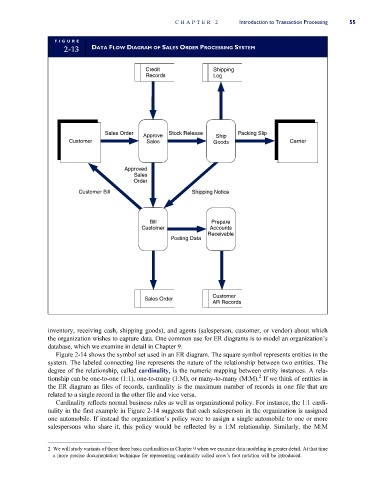
2-13 DATA FLOW DIAGRAM OF SALES ORDER PROCESSING SYSTEM
Credit Shipping
Records Log
Sales Order Stock Release Packing Slip
Approve Ship
Customer Sales Goods Carrier
Approved
Sales
Order
Customer Bill Shipping Notice
Bill Prepare
Customer Accounts
Receivable
Posting Data
Customer
Sales Order
AR Records
inventory, receiving cash, shipping goods), and agents (salesperson, customer, or vendor) about which
the organization wishes to capture data. One common use for ER diagrams is to model an organization’s
database, which we examine in detail in Chapter 9.
Figure 2-14 shows the symbol set used in an ER diagram. The square symbol represents entities in the
system. The labeled connecting line represents the nature of the relationship between two entities. The
degree of the relationship, called cardinality, is the numeric mapping between entity instances. A rela-
2
tionship can be one-to-one (1:1), one-to-many (1:M), or many-to-many (M:M). If we think of entities in
the ER diagram as files of records, cardinality is the maximum number of records in one file that are
related to a single record in the other file and vice versa.
Cardinality reflects normal business rules as well as organizational policy. For instance, the 1:1 cardi-
nality in the first example in Figure 2-14 suggests that each salesperson in the organization is assigned
one automobile. If instead the organization’s policy were to assign a single automobile to one or more
salespersons who share it, this policy would be reflected by a 1:M relationship. Similarly, the M:M
2 We will study variants of these three basic cardinalities in Chapter 9 when we examine data modeling in greater detail. At that time
a more precise documentation technique for representing cardinality called crow’s foot notation will be introduced.