
Page 293 - Acquisition and Processing of Marine Seismic Data
P. 293
284 5. PREPROCESSING
P
P
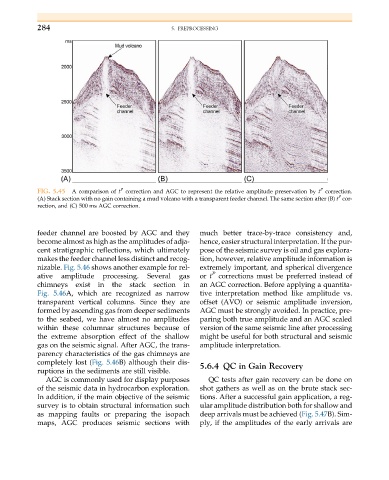
FIG. 5.45 A comparison of t correction and AGC to represent the relative amplitude preservation by t correction.
P
(A) Stack section with no gain containing a mud volcano with a transparent feeder channel. The same section after (B) t cor-
rection, and (C) 500 ms AGC correction.
feeder channel are boosted by AGC and they much better trace-by-trace consistency and,
become almost as high as the amplitudes of adja- hence, easier structural interpretation. If the pur-
cent stratigraphic reflections, which ultimately pose of the seismic survey is oil and gas explora-
makes the feeder channel less distinct and recog- tion, however, relative amplitude information is
nizable. Fig. 5.46 shows another example for rel- extremely important, and spherical divergence
P
ative amplitude processing. Several gas or t corrections must be preferred instead of
chimneys exist in the stack section in an AGC correction. Before applying a quantita-
Fig. 5.46A, which are recognized as narrow tive interpretation method like amplitude vs.
transparent vertical columns. Since they are offset (AVO) or seismic amplitude inversion,
formed by ascending gas from deeper sediments AGC must be strongly avoided. In practice, pre-
to the seabed, we have almost no amplitudes paring both true amplitude and an AGC scaled
within these columnar structures because of version of the same seismic line after processing
the extreme absorption effect of the shallow might be useful for both structural and seismic
gas on the seismic signal. After AGC, the trans- amplitude interpretation.
parency characteristics of the gas chimneys are
completely lost (Fig. 5.46B) although their dis- 5.6.4 QC in Gain Recovery
ruptions in the sediments are still visible.
AGC is commonly used for display purposes QC tests after gain recovery can be done on
of the seismic data in hydrocarbon exploration. shot gathers as well as on the brute stack sec-
In addition, if the main objective of the seismic tions. After a successful gain application, a reg-
survey is to obtain structural information such ular amplitude distribution both for shallow and
as mapping faults or preparing the isopach deep arrivals must be achieved (Fig. 5.47B). Sim-
maps, AGC produces seismic sections with ply, if the amplitudes of the early arrivals are