
Page 349 - Acquisition and Processing of Marine Seismic Data
P. 349
340 6. DECONVOLUTION
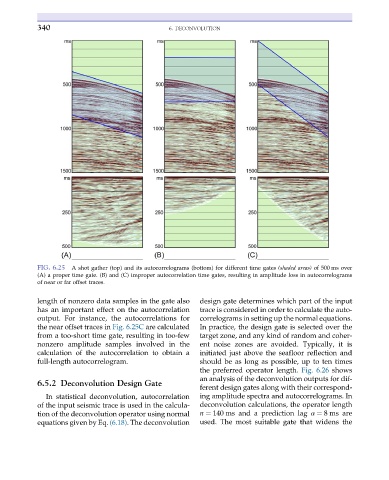
FIG. 6.25 A shot gather (top) and its autocorrelograms (bottom) for different time gates (shaded areas) of 500 ms over
(A) a proper time gate. (B) and (C) improper autocorrelation time gates, resulting in amplitude loss in autocorrelograms
of near or far offset traces.
length of nonzero data samples in the gate also design gate determines which part of the input
has an important effect on the autocorrelation trace is considered in order to calculate the auto-
output. For instance, the autocorrelations for correlograms in setting up the normal equations.
the near offset traces in Fig. 6.25C are calculated In practice, the design gate is selected over the
from a too-short time gate, resulting in too-few target zone, and any kind of random and coher-
nonzero amplitude samples involved in the ent noise zones are avoided. Typically, it is
calculation of the autocorrelation to obtain a initiated just above the seafloor reflection and
full-length autocorrelogram. should be as long as possible, up to ten times
the preferred operator length. Fig. 6.26 shows
an analysis of the deconvolution outputs for dif-
6.5.2 Deconvolution Design Gate
ferent design gates along with their correspond-
In statistical deconvolution, autocorrelation ing amplitude spectra and autocorrelograms. In
of the input seismic trace is used in the calcula- deconvolution calculations, the operator length
tion of the deconvolution operator using normal n ¼ 140 ms and a prediction lag α ¼ 8 ms are
equations given by Eq. (6.18). The deconvolution used. The most suitable gate that widens the