Page 346 - Acquisition and Processing of Marine Seismic Data
P. 346
6.5 DETERMINATION OF DECONVOLUTION PARAMETERS               337

           The term on the righthand side of Eq. (6.20) is  α ¼ unity (the sampling rate), the process is
           the α units advanced version of the autocorrela-  equivalent to a spiking deconvolution.
           tion function. The actual predictive deconvolu-  In general, predictive deconvolution has two
                                                        applications:
           tion output calculated by convolving the h i
           coefficients with the f i input series is given in  i. Application for a spiking deconvolution
           Table 6.14. The output is a prediction of the input  using a unit (or close to unit) prediction
           f i series for α ¼ 3 units. Here, the (h 0 , h 1 , h 2 , h 3 , h 4 ,  lag: used for temporal resolution
           h 5 ) series is termed a prediction filter, which
                                                           improvement.
           yields the predictable components in the seismic
                                                        ii. Prediction of the input trace in a future time
           trace corresponding to multiple reflections,
                                                           period defined by the prediction lag: used to
           whereas the (1, 0, 0,  h 0 ,  h 1 ,  h 2 ,  h 3 ,  h 4 )
                                                           predict and suppress multiples.
           series is known as a prediction error filter, which
           yields the error in the prediction process corre-  The effects of the spiking and predictive decon-
           sponding to primary reflections.             volution approaches on the whitening of the
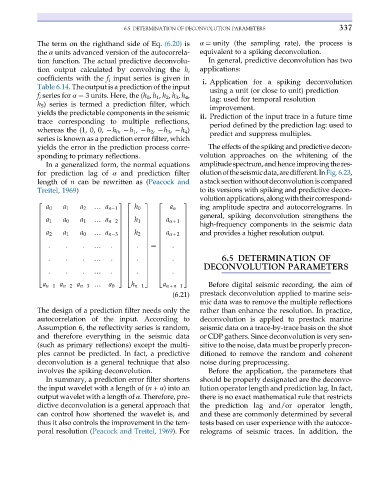
              In a generalized form, the normal equations  amplitudespectrum,andhenceimprovingtheres-
           for prediction lag of α and prediction filter  olutionoftheseismicdata,aredifferent.InFig.6.23,
           length of n can be rewritten as (Peacock and  a stack section without deconvolution iscompared
           Treitel, 1969)                               to its versions with spiking and predictive decon-
                                                        volutionapplications,alongwiththeircorrespond-
           2                      3 2    3   2      3
              a 0  a 1  a 2  … a n 1  h 0       a α     ing amplitude spectra and autocorrelograms. In
                                                        general, spiking deconvolution strengthens the
           6                      7 6    7   6      7
           6  a 1  a 0  a 1  … a n 2  7 6  h 1  7  6  a α +1  7
           6                      7 6    7   6      7   high-frequency components in the seismic data
           6                      7 6    7   6      7
           6  a 2  a 1  a 0  … a n 3  7 6  h 2  7  6  a α +2  7  and provides a higher resolution output.
           6                      7 6    7   6      7
           6                      7 6    7   6      7
              :    :    :       :      :         :
           6               …      7 6    7  ¼  6    7
           6                      7 6    7   6      7
           6                      7 6    7   6      7
           6  :    :    :  …    :  7 6  :  7  6  :  7         6.5 DETERMINATION OF
           6                      7 6    7   6      7
                                                         DECONVOLUTION PARAMETERS
           6                      7 6    7   6      7
              :    :    :       :      :         :
           6               …      7 6    7   6      7
           4                      5 4    5   4      5
                               a 0   h n 1    a α + n 1    Before digital seismic recording, the aim of
             a n 1 a n 2 a n 3 …
                                                 (6.21)  prestack deconvolution applied to marine seis-
                                                        mic data was to remove the multiple reflections
           The design of a prediction filter needs only the  rather than enhance the resolution. In practice,
           autocorrelation of the input. According to   deconvolution is applied to prestack marine
           Assumption 6, the reflectivity series is random,  seismic data on a trace-by-trace basis on the shot
           and therefore everything in the seismic data  or CDP gathers. Since deconvolution is very sen-
           (such as primary reflections) except the multi-  sitive to the noise, data must be properly precon-
           ples cannot be predicted. In fact, a predictive  ditioned to remove the random and coherent
           deconvolution is a general technique that also  noise during preprocessing.
           involves the spiking deconvolution.             Before the application, the parameters that
              In summary, a prediction error filter shortens  should be properly designated are the deconvo-
           the input wavelet with a length of (n + α) into an  lution operator length and prediction lag. In fact,
           output wavelet with a length of α. Therefore, pre-  there is no exact mathematical rule that restricts
           dictive deconvolution is a general approach that  the prediction lag and/or operator length,
           can control how shortened the wavelet is, and  and these are commonly determined by several
           thus it also controls the improvement in the tem-  tests based on user experience with the autocor-
           poral resolution (Peacock and Treitel, 1969). For  relograms of seismic traces. In addition, the

