
Page 343 - Acquisition and Processing of Marine Seismic Data
P. 343
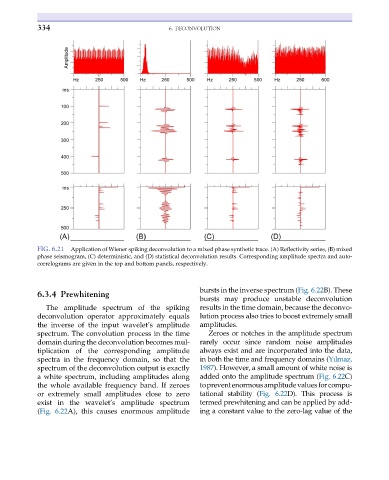
334                                  6. DECONVOLUTION


           FIG. 6.21  Application of Wiener spiking deconvolution to a mixed phase synthetic trace. (A) Reflectivity series, (B) mixed
           phase seismogram, (C) deterministic, and (D) statistical deconvolution results. Corresponding amplitude spectra and auto-
           correlograms are given in the top and bottom panels, respectively.


                                                        bursts in the inverse spectrum (Fig. 6.22B). These
           6.3.4 Prewhitening
                                                        bursts may produce unstable deconvolution
              The amplitude spectrum of the spiking     results in the time domain, because the deconvo-
           deconvolution operator approximately equals  lution process also tries to boost extremely small
           the inverse of the input wavelet’s amplitude  amplitudes.
           spectrum. The convolution process in the time   Zeroes or notches in the amplitude spectrum
           domain during the deconvolution becomes mul-  rarely occur since random noise amplitudes
           tiplication of the corresponding amplitude   always exist and are incorporated into the data,
           spectra in the frequency domain, so that the  in both the time and frequency domains (Yılmaz,
           spectrum of the deconvolution output is exactly  1987). However, a small amount of white noise is
           a white spectrum, including amplitudes along  added onto the amplitude spectrum (Fig. 6.22C)
           the whole available frequency band. If zeroes  topreventenormousamplitudevaluesforcompu-
           or extremely small amplitudes close to zero  tational stability (Fig. 6.22D). This process is
           exist in the wavelet’s amplitude spectrum    termed prewhitening and can be applied by add-
           (Fig. 6.22A), this causes enormous amplitude  ing a constant value to the zero-lag value of the