
Page 347 - Acquisition and Processing of Marine Seismic Data
P. 347
338 6. DECONVOLUTION
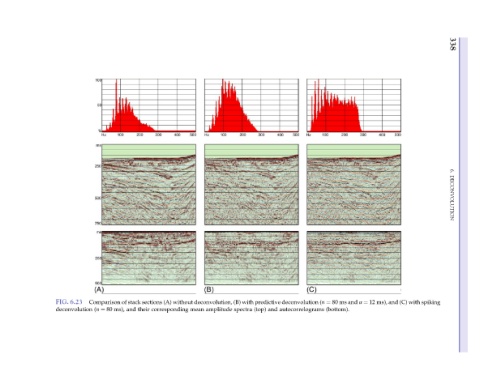
ms), and (C) with spiking
80 ms and α ¼ 12 (bottom).
autocorrelograms
and
(top)
spectra
amplitude Comparison of stack sections (A) without deconvolution, (B) with predictive deconvolution (n ¼
mean
corresponding
their
and
ms),
(n ¼ 80
FIG. 6.23 deconvolution