
Page 463 - Acquisition and Processing of Marine Seismic Data
P. 463
454 9. VELOCITY ANALYSIS
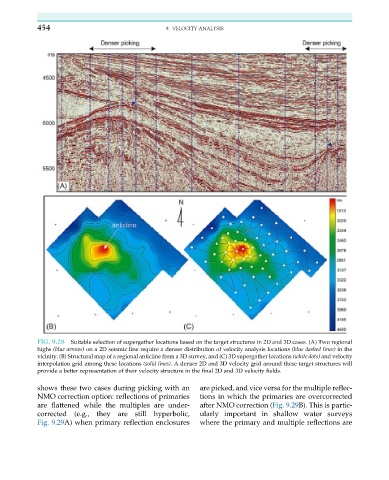
FIG. 9.28 Suitable selection of supergather locations based on the target structures in 2D and 3D cases. (A) Two regional
highs (blue arrows) on a 2D seismic line require a denser distribution of velocity analysis locations (blue dashed lines) in the
vicinity. (B) Structural map of a regional anticline from a 3D survey, and (C) 3D supergather locations (white dots) and velocity
interpolation grid among these locations (solid lines). A denser 2D and 3D velocity grid around these target structures will
provide a better representation of their velocity structure in the final 2D and 3D velocity fields.
shows these two cases during picking with an are picked, and vice versa for the multiple reflec-
NMO correction option: reflections of primaries tions in which the primaries are overcorrected
are flattened while the multiples are under- after NMO correction (Fig. 9.29B). This is partic-
corrected (e.g., they are still hyperbolic, ularly important in shallow water surveys
Fig. 9.29A) when primary reflection enclosures where the primary and multiple reflections are