
Page 460 - Acquisition and Processing of Marine Seismic Data
P. 460
9.3 VELOCITY ANALYSIS IN PRACTICE 451
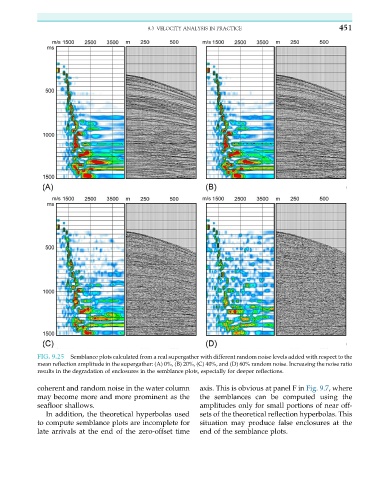
FIG. 9.25 Semblance plots calculated from a real supergather with different random noise levels added with respect to the
mean reflection amplitude in the supergather: (A) 0%, (B) 20%, (C) 40%, and (D) 60% random noise. Increasing the noise ratio
results in the degradation of enclosures in the semblance plots, especially for deeper reflections.
coherent and random noise in the water column axis. This is obvious at panel F in Fig. 9.7, where
may become more and more prominent as the the semblances can be computed using the
seafloor shallows. amplitudes only for small portions of near off-
In addition, the theoretical hyperbolas used sets of the theoretical reflection hyperbolas. This
to compute semblance plots are incomplete for situation may produce false enclosures at the
late arrivals at the end of the zero-offset time end of the semblance plots.