
Page 457 - Acquisition and Processing of Marine Seismic Data
P. 457
448 9. VELOCITY ANALYSIS
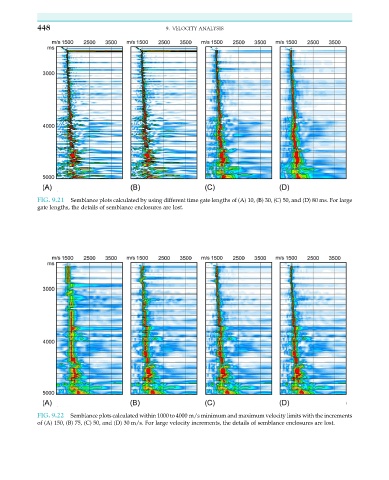
FIG. 9.21 Semblance plots calculated by using different time gate lengths of (A) 10, (B) 30, (C) 50, and (D) 80 ms. For large
gate lengths, the details of semblance enclosures are lost.
FIG. 9.22 Semblance plots calculated within 1000 to 4000 m/s minimum and maximum velocity limits with the increments
of (A) 150, (B) 75, (C) 50, and (D) 30 m/s. For large velocity increments, the details of semblance enclosures are lost.