
Page 458 - Acquisition and Processing of Marine Seismic Data
P. 458
9.3 VELOCITY ANALYSIS IN PRACTICE 449
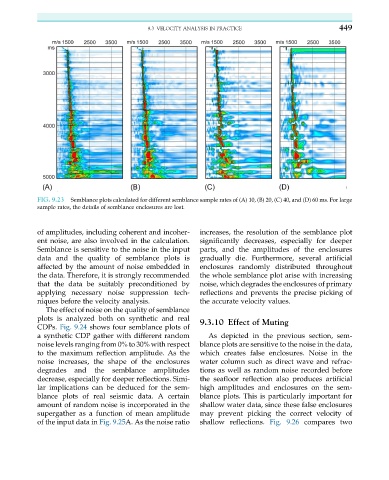
FIG. 9.23 Semblance plots calculated for different semblance sample rates of (A) 10, (B) 20, (C) 40, and (D) 60 ms. For large
sample rates, the details of semblance enclosures are lost.
of amplitudes, including coherent and incoher- increases, the resolution of the semblance plot
ent noise, are also involved in the calculation. significantly decreases, especially for deeper
Semblance is sensitive to the noise in the input parts, and the amplitudes of the enclosures
data and the quality of semblance plots is gradually die. Furthermore, several artificial
affected by the amount of noise embedded in enclosures randomly distributed throughout
the data. Therefore, it is strongly recommended the whole semblance plot arise with increasing
that the data be suitably preconditioned by noise, which degrades the enclosures of primary
applying necessary noise suppression tech- reflections and prevents the precise picking of
niques before the velocity analysis. the accurate velocity values.
The effect of noise on the quality of semblance
plots is analyzed both on synthetic and real 9.3.10 Effect of Muting
CDPs. Fig. 9.24 shows four semblance plots of
a synthetic CDP gather with different random As depicted in the previous section, sem-
noise levels ranging from 0% to 30% with respect blance plots are sensitive to the noise in the data,
to the maximum reflection amplitude. As the which creates false enclosures. Noise in the
noise increases, the shape of the enclosures water column such as direct wave and refrac-
degrades and the semblance amplitudes tions as well as random noise recorded before
decrease, especially for deeper reflections. Simi- the seafloor reflection also produces artificial
lar implications can be deduced for the sem- high amplitudes and enclosures on the sem-
blance plots of real seismic data. A certain blance plots. This is particularly important for
amount of random noise is incorporated in the shallow water data, since these false enclosures
supergather as a function of mean amplitude may prevent picking the correct velocity of
of the input data in Fig. 9.25A. As the noise ratio shallow reflections. Fig. 9.26 compares two