
Page 158 - Adsorbents fundamentals and applications
P. 158
CHEMICAL MODIFICATION OF SILICAS AND MOLECULAR IMPRINTING 143
MCM-41 and silica gel as efficient and reusable heterogeneous catalyst for the
Knoevenagel Condensation reactions. Burwell and Leal (1974) first reported
selective chemisorption of sulfur dioxide on amine-modified silica gel. Leal et al.
(1995) studied carbon dioxide adsorption on amine surface-bonded silica gel,
although their CO 2 adsorption amount (0.3 mmol/g-sorbent at 1 atm CO 2 )was
low. Further work by Huang et al. (2003) produced high-capacity and selective
sorbents for both CO 2 and H 2 S.
Their work is summarized briefly: Silica xerogels and MCM-48 were used.
The xerogels were prepared from tetraethoxysilane (TEOS) by using standard
technique, and the MCM-48 was prepared by the techniques developed by Schu-
macher et al. (2000). These silicas were used because of their high surface areas
2
2
(816 m /g for xerogels, and 1389 m /g for MCM-48) and high silanol numbers
(∼5 and 8, respectively), as well as thermal stability (MCM-48 is more stable
than MCM-41). 3-Aminopropyltriethoxysilane was grafted on these silicas.
The coverages of about 1.7 and 2.3 mmol — CH 2 CH 2 CH 2 NH 2 per gram
of sorbent were obtained for silica xerogel and MCM-48, respectively. The
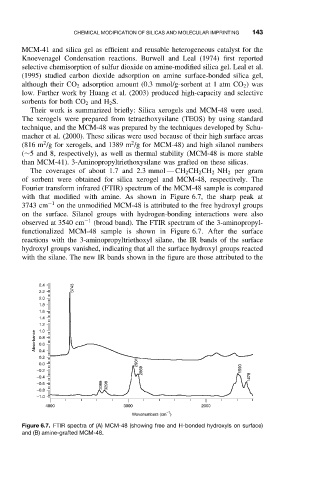
Fourier transform infrared (FTIR) spectrum of the MCM-48 sample is compared
with that modified with amine. As shown in Figure 6.7, the sharp peak at
3743 cm −1 on the unmodified MCM-48 is attributed to the free hydroxyl groups
on the surface. Silanol groups with hydrogen-bonding interactions were also
observed at 3540 cm −1 (broad band). The FTIR spectrum of the 3-aminopropyl-
functionalized MCM-48 sample is shown in Figure 6.7. After the surface
reactions with the 3-aminopropyltriethoxyl silane, the IR bands of the surface
hydroxyl groups vanished, indicating that all the surface hydroxyl groups reacted
with the silane. The new IR bands shown in the figure are those attributed to the
2.4 3743
2.2
2.0
1.8
1.6
1.4
1.2
1.0
Absorbance 0.8
0.6
0.4
0.2
2931
0.0
−0.2 2869 1590
−0.4 1478
−0.6 3368 3298
−0.8
−1.0
4000 3000 2000
−1
Wavenumbers (cm )
Figure 6.7. FTIR spectra of (A) MCM-48 (showing free and H-bonded hydroxyls on surface)
and (B) amine-grafted MCM-48.