Page 85 - Adsorption Technology & Design, Elsevier (1998)
P. 85

82  Rates  of  adsorption  of  gases and  vapours  by porous  media


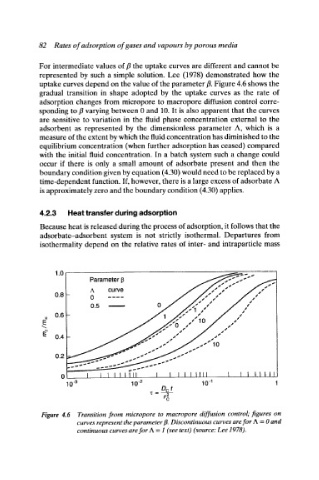
            For intermediate  values of fl the  uptake curves are different  and cannot be
            represented  by such  a  simple  solution.  Lee  (1978)  demonstrated  how  the
            uptake curves depend on the value of the parameter ft. Figure 4.6 shows the
            gradual  transition  in  shape  adopted  by  the  uptake  curves  as  the  rate  of
            adsorption  changes  from  micropore  to  macropore  diffusion  control  corre-
            sponding  to fl varying between 0 and  10. It is also apparent  that  the curves
            are  sensitive  to  variation  in  the  fluid  phase  concentration  external  to  the
            adsorbent  as  represented  by  the  dimensionless  parameter  A,  which  is  a
            measure of the extent by which the fluid concentration has diminished to the
            equilibrium  concentration  (when further  adsorption  has ceased)  compared
            with  the  initial  fluid  concentration.  In  a  batch  system such  a change  could
            occur  if  there  is  only  a  small  amount  of  adsorbate  present  and  then  the
            boundary condition given by equation (4.30) would need to be replaced by a
            time-dependent function.  If, however, there is a large excess of adsorbate  A
            is approximately zero and the boundary condition (4.30) applies.

            4.2.3   Heat transfer during adsorption

            Because heat is released during the process of adsorption, it follows that the
            adsorbate-adsorbent  system  is  not  strictly  isothermal.  Departures  from
            isothermality  depend  on  the  relative  rates  of inter-  and  intraparticle  mass


                1.0
                         Parameter  13
                          A   curve
                                                        S SS-S S S
                0.8           ,==..,= ,=. ,,.
                                                        S   S        S
                                                       S   S        S
                                                      i   S         S
                          0.5
                                                                   S
                                                      |   s  S
                                                                  S
                                                      s           I
                0.6
             8                                                   S
                                                     s  S
                                                                S
                                                    s   10
             E
                                                              s
                                                  s           s
                                                  s          s
                                                 s          s
             E
                                                s          s
                0.4
                                               s          s
                                              s         js
                                                      _..   10
                0.2
                         !   I  I  I  I IIII   I   I  I  I  I  IIII   I   i  I  I IIII
                                     10. 2              10 "1
                   10 -3
                                             Dot
                                          1;--   r  2
            Figure 4.6  Transition  from  micropore  to  macropore  diffusion  control; figures  on
                      curves represent the parameter ft. Discontinuous curves are for A  = 0 and
                      continuous curves are for A  = 1 (see texO (source: Lee 1978).
   80   81   82   83   84   85   86   87   88   89   90